Counting a Snowflake proxy's users without becoming its honeypot
What a Snowflake proxy can see about the people who use it, what a hostile operator in that seat could do with it, and how I count my clients per country while keeping nothing, on the box or off it, that could point back at one of them.
Scope: One packaged snowflake-proxy 2.5.1 on a Raspberry Pi 1 Model B, restricted NAT behind carrier-grade NAT, real Tor clients, 29 October 2026.
Method: Inbound STUN packets on the proxy's ICE port range, counted per country in memory in 15-minute windows and compared hour by hour with the proxy's own summaries over one full day (29 October 2026).
Contents
My Raspberry Pi 1 has been relaying Tor traffic as a Snowflake proxy since 20 October. The first entry covers the setup. This one started with a simple question: where do the people using it come from?
The proxy could answer that, because it sees every client’s address. That is also the problem. Many Snowflake users live in countries where using Tor at all can get them into trouble, and a list of their addresses is the worst thing a proxy operator can end up holding. So the question I actually tried to answer was narrower: can I count clients per country without keeping any of their addresses?
It turned out I could. The address is in one packet the proxy never logs, the STUN connectivity check, and a four-byte match in a kernel filter picks out exactly those packets. A small Python program counts countries in memory and forgets each address as soon as it is counted. A second count, independent of the first, says whether the numbers can be trusted. And on the way I found a memory limit that systemd had accepted, printed back and never enforced, which is worth checking on any box where you rely on one. This entry is how I got there, wrong turns included.
Running a Snowflake proxy puts you in the one position in the Tor network that always sees a user’s real address: the first hop. An honest operator’s whole job is to make sure that, whatever happens to the machine later, it can never produce the list of who those users were. A hostile operator’s whole purpose is to produce exactly that list. The protocol cannot tell the two apart. So this entry is also a map of what the seat I volunteered for is worth to someone who would use it against the people it is meant to help.
Where the question came from
Every day a small rule in my log collector sends me a digest of the proxy’s last 24 hours. On 28 October it reported 282 connections, against a median of 162 for the week before. It also reported two numbers that could not be true: twelve “concurrent” clients on a proxy limited to ten (-capacity 10), and 94 fifteen-minute windows by 22:05, when at most 88 fit.
Both were my own mislabelled fields. The window count took every event in the index, not just the proxy’s summaries, so a few WebRTC error lines and the startup lines from a reboot added seven. The “concurrent” figure came from this line:
In the last 15m0s, there were 1 connections. Traffic Relayed ↑ 19 KB, ↓ 21 KB.
That is connections that ended in the window, not clients connected at once. Twelve can end in fifteen minutes without more than ten ever running together. (The Pi had also rebooted at about 21:20, by the look of the logs not cleanly. That is a lab problem, not this entry’s.)
With the labels fixed, the 282 connections were real (the calendar day closed at 284), and the extra ones came in the morning:
| 27 October | 28 October | |
|---|---|---|
| connections, 04:00-12:00 | 56 | 145 |
| connections, whole day | 215 | 284 |
| busiest hour | 14:00, 23 connections | 07:00, 36 connections |
| traffic to clients per connection in the busiest hour | 5.2 MB | 135 KB |
Lots of connections, very little traffic in each. Two explanations fit, and they point in opposite directions:
- Demand. 07:00 in Warsaw at the end of October is 09:30 in Tehran, and Iran has been one of the largest groups of Snowflake users for years.
- Failure. My proxy sits behind restricted NAT. A client can get a connection up, move a few kilobytes and drop. That also looks like many short connections.
The summaries have no countries and no reason for a connection ending, so they cannot tell the two apart. A count per country would help with the first. A second counter that does not depend on the proxy’s own would help with the second. Both need the client’s address, so before building anything I wanted to be clear about what holding it means.
What a hostile operator in this seat can take
Nothing about my counter changes the basic fact: a Snowflake proxy is the client’s direct WebRTC peer, so it sees the address every client reaches it from, logging on or off. It never sees what is inside; the encrypted Tor traffic goes on to the bridge and stays sealed. It knows who connects, not where they go or what they send, which puts it in the same position as a bridge or a Tor guard. What is worth being precise about is what that position is worth to someone who runs a proxy in order to use it, because that decides what my own rules have to protect and what they never can.
Two attacks, kept apart, because they cost different things and are defended against differently.
Membership: cheap, scalable, and the one Snowflake does not stop at this layer. A censor breaks nothing. It volunteers proxies like anyone else, lets the broker hand it a share of the clients asking for help, and writes down who turns up. Across many cheap proxies over time, that is a rolling sample of its own citizens reaching for Tor. Where using Tor is itself the offence, that list is the entire harm, and nothing further has to happen. This is the part people get backwards. Snowflake’s camouflage, traffic shaped like an ordinary video call, defeats the censor watching the network. It does nothing against the censor running the proxy, who is your peer and reads your address directly. Snowflake hides that you use Tor from the wire. It does not hide it from the far end of your own connection.
Deanonymisation: linking that address to what the person did. Much harder, and not something the seat gives on its own. The proxy sees that you connected, roughly how much, and when. It does not see where the traffic goes or what is in it; that stays inside the circuit that continues past the bridge. Turning “this address used Tor at 07:15” into “this person did that” needs the same adversary to also watch the other end, the destination or the exit, and match the two by timing and volume. That is the end-to-end correlation attack Tor has always been open about, and a hostile proxy is one convenient vantage point for it, not the attack itself. It helps an adversary who already has reach at both ends. It does nothing for one who holds only the proxy.
Three properties make membership the attack to take seriously, and all three are structural, not something I could patch on my box:
- The position needs no privilege and no trick. Being the entry hop is the normal, intended role. The address arrives as a side effect of carrying the traffic. There is nothing to exploit, only a decision about what to keep.
- The broker does the sampling for you. Clients are matched to proxies by the broker, so a fleet of cheap proxies collects a spread of a country’s users without targeting anyone. Scale is a budget line, not a capability.
- The evidence is deniable and the data arrives pre-sorted. A proxy quietly keeping addresses looks identical to one that does not. The operator ends up holding precisely the list a censor wants, already narrowed to people who were trying to evade it.
Two facts about the existing system set the boundary of what I can do about any of this.
- Scrubbing protects an honest operator’s data, nothing more. The proxy removes addresses from its logs by default. A malicious operator undoes that with one line of code, or just runs
tcpdump. What scrubbing does protect is data at rest: logs that survive a stolen disk, a seized machine, a leaked backup, or a log pipeline run by someone else. - The address already goes further than the proxy. According to the project’s issue tracker, the proxy takes the client’s address from the WebRTC offer and passes it to the bridge as a
client_ipparameter on the WebSocket connection. The bridge hands it to its tor process, and tor’s statistics are what the Tor Project’s per-country Snowflake graphs are built from. Those statistics are rounded: a bridge reports unique addresses per country over a day, rounded up to the nearest multiple of 8, so one client and eight look the same.
So the only promise a proxy operator can honestly make is a negative one. Not that I protect users against a hostile operator: I cannot, and if I chose to keep that list I would be the hostile operator. Anyone with root on the Pi while it runs already sees every address, and nothing I build changes that. What I can control is what is left afterwards, and the rule is flat: an address must never reach a disk, a log line, a third party or a crash dump, and nothing I store or publish may be small and precise enough to point at one person. The whole second half of this entry is that rule being kept.
The doors I closed, in order
Before I found the packet that works, I reached for four other ways to the address and closed each one. They are worth keeping in the order I tried them, because the reason each failed is the reason the one that worked has the shape it does.
Built-in metrics: not in this version. I thought the proxy could export metrics. The installed 2.5.1 has no such flag. Upstream added -metrics, which serves Prometheus counters, in 2.7.0 (October 2023), and a country label on the connection counter in 2.11.0 (early 2025). So a current proxy will count countries for you. The one my distribution ships is older, and building from source for an ARMv6 board that faces the internet means giving up the distribution’s updates. That closed the one honest shortcut, letting the proxy count for itself, for the version I run rather than for the idea. On a newer box it is the route I would take first, though I have not checked how its country counter treats small numbers.
-unsafe-logging and counting in RAM. My first idea was to turn off scrubbing, read the log with a small program, count countries and drop each address straight away. The counting is easy. The problem is everywhere else the address goes:
- The log path. The proxy writes to stderr, systemd sends stderr to the journal, and my shipper sends the journal to the log collector. Turn on unsafe logging in this setup and every address ends up in an indexed database on another machine. Not as an edge case: that is what happens unless you redirect the output.
- Crash dumps. If the counting program crashes and the system keeps core dumps, the dump is a copy of memory with addresses in it.
- Swap. Memory swapped out to an SD card is memory written to disk. On this Pi swap is compressed RAM (zram), so this one was already covered.
- Online lookups. A GeoIP web API means sending every address to a third party. The database has to be local.
- Small numbers. A record like “one client from country X at 07:15, 4 MB” contains no address, but anyone who also has network logs from country X can match it to one person.
The first point settled it. Making unsafe logging safe means working against the default at every step, and one mistake in a config file undoes all of it. I left the proxy as it was, scrubbing on, and looked for the address somewhere it is never logged.
The network. The proxy uses the fixed UDP range 61000-61039 for WebRTC (part one, step 4), so every client’s packets arrive there.
ss, the socket list, was my first try and showed nothing useful. I expected the remote end of each session. Instead the proxy’s sockets are unconnected and show the peer as 0.0.0.0:*: the WebRTC library sends to any peer from one socket. The number of sockets in the range is still useful: it is a rough count of sessions running right now, the concurrency figure part one did not have, and it needs no address at all. It does need calibrating, because two sockets per client is an assumption. As a way to countries, ss was a dead end.
Connection tracking I ruled out without trying it on the Pi. It would see every flow, but during setup the proxy also tries the client’s private and local addresses, which the client lists in its offer, so a good part of what it records says nothing about a country. That mixed-in noise was enough to close it before it ever ran on the box.
The packet the proxy never logs
What I needed was a packet that has to arrive for a connection to form and that the proxy never writes down. Before WebRTC carries any data, both ends exchange STUN connectivity checks. Every STUN packet carries the same four bytes, the magic cookie 0x2112A442, at the same position: the UDP header is 8 bytes and the cookie starts 4 bytes into the STUN message, so in a capture filter it is udp[12:4]. Capture only inbound packets, and the source address is the address the client actually reached me from:
sudo tcpdump -ni eth0 -p -Q in -q \
  'udp dst portrange 61000-61039 and udp[12:4] = 0x2112a442 and not src port 19302'
not src port 19302 drops the answers from the public STUN server the proxy uses to learn its own address. There is no IPv6 branch because IPv6 is off on this box (part one, step 1).
The filter runs in the kernel, so the relayed traffic never reaches the capture program, only the connectivity checks. On a single 700 MHz core that matters. The busiest hour of the first night brought 1,947 of them. In its first minutes, at a quiet hour, ps showed tcpdump at 0.0% CPU.
That one line is also, unchanged, everything the membership attack above needs. Send its output to a file instead of to a counter and you have the list. What separates counting from collecting is entirely what the next program does with each line, which is why the rest of this entry is about that program.
Could the encrypted traffic match by accident? WebRTC stacks tell the protocols sharing a port apart by the first byte of each packet (RFC 7983): 0 to 3 is STUN, 20 to 63 is DTLS. The cookie test is stricter than that. In a DTLS 1.2 record the four bytes at that offset are the low byte of the epoch and the top three bytes of the 48-bit sequence number. For a match the epoch would have to reach 33 (0x21), where a normal session stays at 0 or 1, and the sequence number would have to be past 0x12A442 × 2²⁴, some 2 × 10¹³ records into the epoch. Neither happens. DTLS 1.3 lays its record header out differently: with its short header those bytes fall mostly in encrypted sequence numbers and ciphertext, so a match comes down to chance, on the order of one packet in four billion. I have not confirmed on the wire that neither end negotiates 1.3. Even if one did, a false match is close to harmless: it carries the address of a client that is already connected, which the counter has just seen and will not count again.
I tested the filter on a laptop before trusting it on the Pi, with six probe packets through the loopback interface:
| probe | expected | captured |
|---|---|---|
| STUN to port 61004 | yes | yes |
| STUN to port 61039, the end of the range | yes | yes |
| DTLS-like packet to 61004, no cookie | no | no |
| STUN to port 61040, outside the range | no | no |
| STUN from source port 19302 | no | no |
| STUN from a port in the range, to a port outside it | no | no |
Each capture line looks like this (documentation addresses):
IP 203.0.113.7.50112 > 192.0.2.115.61004: UDP, length 20
The counter
The capture feeds one small Python program (standard library only). For each packet it:
- takes the source address and drops private, shared (CGNAT), loopback, link-local, multicast and reserved ranges;
- computes an HMAC-SHA256 of the address with a random 32-byte key that exists only in memory and changes every day, and keeps 24 bits of it, enough to tell “seen this one already” from “new”;
- if the address has been silent for more than ten minutes, counts it as a new client and looks up its country in a local database;
- forgets the address.
Every fifteen minutes it prints one line of counts per country to the journal, and nothing else. This is a real line from the Pi, the first window after a restart, which the counter saw for 164 of its 900 seconds and in which no client arrived:
{"v":1,"start":"2026-10-28T23:30:00+0100","window_s":900,"covered_s":164,"new_clients":0,"cc":{},"stun_pkts":0,"nonpublic_pkts":0,"parse_err":0,"sock_max":2,"sock_avg":0.2,"sock_samples":17,"tracked":0,"partial":true}
cc holds the counts per country, stun_pkts the packets that matched the filter, sock_max the most proxy sockets seen open in the port range, and tracked how many hashes the counter currently remembers.
Some of the decisions need explaining.
The key never leaves memory, and that is the protection. I first thought of the 24-bit truncation as the main safeguard: each stored value matches about 256 addresses out of the whole IPv4 space, so even someone with the key and the table could not rebuild a clean list. That is weaker than it sounds. Someone who already has a list of candidates, a censor with its own subscribers’ addresses for example, can hash those and check them. With three million candidates, about 0.18 of them land on any given stored value by chance, so a match is a real hit roughly five times in six. What actually protects the hashes is that the key and the table exist only in the running process. The table is also short: an address silent for more than ten minutes is dropped at the next window boundary, and the whole table goes when the key changes each day. Anyone who can read that memory can also run the capture, which puts them outside what I can protect against anyway.
Twenty-four bits, seen from the other side. The truncation also has to leave the hash wide enough not to merge two clients into one. Even with a hundred hashes in the table at once, the chance that any two collide is about three in ten thousand, and a collision only makes one new client look like a returning one.
The country database is local, and comes from Tor. Debian ships Tor’s own GeoIP file in tor-geoipdb: 397,660 IPv4 ranges in the copy Raspberry Pi OS ships, converted from IPFire’s location data according to its header. No lookup leaves the box. The package depends on tor, and I did not want a Tor daemon on a Pi 1 for the sake of a data file, so I extracted the file without installing the package:
cd /tmp && apt-get download tor-geoipdb
dpkg-deb -x tor-geoipdb_*.deb /tmp/tgdb
sudo install -D -m 0644 /tmp/tgdb/usr/share/tor/geoip /usr/local/share/sfgeo/geoip
Loaded into compact arrays it takes about 6 MB. Loading takes 0.2 seconds on a laptop and 24 seconds on the Pi, once per start. A lookup is a binary search, well under a microsecond on the laptop.
Errors must not print what they were working on. A Python traceback can print the line it failed on, and that line contains an address. So once packets flow, the program prints only the type of an error, never its contents, and sends tcpdump’s own messages nowhere. The one message with contents is a failure to load the GeoIP file at start, before the first packet, and it can only quote the file. I went through every output path, fatal errors included, looking for anything shaped like an address, and found none.
inet_aton is the wrong parser. It happily accepts a three-part string like 1.2.3 and pads it into a full address, so a truncated capture line would be read as valid and counted in some random country. inet_pton takes only four full octets and rejects the rest.
Ten minutes of silence makes a new client. A live WebRTC session keeps exchanging STUN checks for as long as it runs, so a long session counts once. On the Pi one client sent 29 of them in about five minutes, roughly one every ten seconds. A client that drops and comes back within ten minutes also counts once. That makes it a different measure from the proxy’s summaries, which count ended connections, and the check below relies on that difference.
Incomplete windows say so. Windows are aligned to the clock (:00, :15, :30, :45), so a counter started at 23:24 reports a window labelled 23:15 that it saw for a few minutes. My first version did not mark that, and would have quietly undercounted after every restart. Each line now carries how many seconds of its window it saw, and is marked partial when that is less than all of it. The same fix showed the problem at the other end: systemctl restart sends SIGTERM, Python by default dies on the spot, and the window in progress was lost. The counter now catches SIGTERM and writes that last partial window before it exits.
“Forgets” means dropped, not wiped. Python cannot overwrite memory it has freed. Until that memory is reused, an address can still be read by anyone who can read the process’s memory, which here means root, who can run the capture anyway.
Running it with one capability
The counter runs as a systemd service, sandboxed the same way as the proxy in part one. Packet capture needs the capability CAP_NET_RAW, and that is the only one it gets. With -p, which leaves the network card out of promiscuous mode, that turned out to be enough. LimitCORE=0 closes the crash-dump path from the list above; without it, a crash on this Pi would leave a plain core file.
[Service]
ExecStart=/usr/bin/python3 -I /usr/local/lib/sfgeo/sfgeo.py --geo /usr/local/share/sfgeo/geoip --iface eth0
Restart=on-failure
RestartSec=30
Nice=10
MemoryMax=64M
LimitCORE=0
UMask=0077
DynamicUser=yes
AmbientCapabilities=CAP_NET_RAW
CapabilityBoundingSet=CAP_NET_RAW
NoNewPrivileges=yes
ProtectSystem=strict
ProtectHome=yes
PrivateTmp=yes
PrivateDevices=yes
ProtectKernelTunables=yes
ProtectKernelModules=yes
ProtectKernelLogs=yes
ProtectControlGroups=yes
ProtectClock=yes
ProtectHostname=yes
RestrictNamespaces=yes
RestrictRealtime=yes
LockPersonality=yes
SystemCallArchitectures=native
RestrictAddressFamilies=AF_PACKET AF_INET AF_UNIX AF_NETLINK
systemd-analyze security scores the unit 3.4, which it labels OK. What exposure is left is the cost of the job itself: a packet socket and CAP_NET_RAW, which the capture needs, and a network the service can still reach. Tightening the system-call filter to @system-service would lower the number further, at the risk of a filter that blocks something the capture or the GeoIP load needs, so I left it.
On the Pi, ps shows 18.8 MB for the counter and 5.8 MB for tcpdump. The kernel’s own accounting for the whole service, once I had switched it on (next section), said 9.1 MiB at first and settles near 9.9 MiB after a day (MemoryCurrent). The two measure different things: ps counts the shared libraries each process has mapped, while the kernel charges a file’s pages to the service that read them first. My guess is that the Python library had already been read by something else on the box. Over its first seven and a half minutes the counter averaged 5.6% of the CPU, nearly all of it the 24-second GeoIP load. By my arithmetic that leaves well under one percent once it is running, and 44 hours of uptime bear that out: the service averaged 0.167% of one core (CPUUsageNSec over elapsed time).
A limit that was only written down
The unit above sets MemoryMax=64M, and the proxy has had MemoryMax=192M since part one. When I asked systemd how much memory the counter was using, it answered [not set].
This Raspberry Pi kernel boots with cgroup_disable=memory, so the memory controller does not exist. The parameter is not in /boot/firmware/cmdline.txt; it is added before the kernel starts, so only /proc/cmdline shows it. systemd accepted both limits anyway, printed them back when asked, and enforced neither. Part one had already hit the same trap with IPAddressDeny=. Twice is enough to treat it as a rule: systemd stores a resource setting whether or not the kernel can enforce it, and reading the setting back proves only that it was stored.
The rule covers every directive that leans on something in the kernel. CPUQuota= needs the cpu controller, IOWeight= needs io, TasksMax= needs pids, the Memory*= family needs memory, and IPAddressDeny= needs a BPF program attached to the service’s cgroup, which is what failed in part one. On this box the first three were there. Memory and the BPF firewall were not.
The check is to look at which controllers exist and to ask for a value only the kernel can fill in:
cat /sys/fs/cgroup/cgroup.controllers
systemctl show -p MemoryMax -p MemoryCurrent sfgeo.service snowflake-proxy.service
Before the fix the first command printed cpu io pids, and MemoryCurrent came back [not set] while MemoryMax faithfully showed the limit I had written.
I turned the controller on by adding cgroup_enable=memory cgroup_memory=1 to /boot/firmware/cmdline.txt and rebooting. The later parameter wins: the controllers now read cpu io memory pids, and MemoryCurrent returns numbers for both services. A limit that works also kills: when a service reaches MemoryMax=, the kernel’s out-of-memory killer acts inside that service’s cgroup. The packaged proxy unit has Restart=no, so the proxy’s drop-in got Restart=on-failure at the same time. Part one now carries a correction. The controller itself costs less than a rough before-and-after can show: free memory at rest fell from 292 MB in part one to about 282 MB, and the counter’s own 10 MiB accounts for nearly all of it.
Does it count what I think?
A new counter is only worth something if you can check it against something it does not depend on. Here that is the proxy’s own summaries. The two measure different things (clients arriving, connections ending), so per window they will not match, but per hour they should move together. To compare them by hour, each record goes to the time it covers: a counter line carries its window’s start, and each proxy summary, logged when its fifteen minutes end, is placed at their middle. Windows marked partial are left out. Each way the two could disagree would mean something:
- Far fewer new clients than connections: the filter misses packets, or clients come back within ten minutes so often that the definition hides them.
- Far more new clients than connections: clients get as far as the connectivity check, but no connection completes. That is the failure explanation for the morning surge.
- Roughly equal, moving together: the method works, and the country counts are as good as the GeoIP data.
The first night, hour by hour (00:00-08:00 on 29 October, full windows only):
| hour | new clients, counter | completed connections, proxy |
|---|---|---|
| 00 | 1 | 0 |
| 01 | 4 | 4 |
| 02 | 3 | 2 |
| 03 | 6 | 5 |
| 04 | 12 | 10 |
| 05 | 12 | 13 |
| 06 | 10 | 8 |
| 07 | 17 | 15 |
| total | 65 | 57 |
They move together and are never more than two apart in any hour, which is the third case. The counter is 14% higher overall. That fits sessions still open at 08:00, since the counter counts a client when it arrives and the proxy counts a connection when it ends. A few clients that never got a connection through would fit too. What did not happen is mass failure, which would show several times more clients than connections. The morning hours were again the busiest of the night (51 clients between 04:00 and 08:00, 46 connections), so most of that rise was demand.
Over the full day of 29 October the counter saw 193 new clients and the proxy logged 160 completed connections, a ratio of 1.21. There were no partial windows that day, so no restart to distort it. The curves still moved together, but less tightly than at night: the largest gap was six, at 09:00 (13 clients, 7 connections), and in 4 of the 24 hours the proxy was ahead. At 21:00 it was ahead with no new client at all: the two connections that ended then belonged to clients the counter had already counted. From 08:00 to midnight the ratio was 1.24. Across the 24 hours the two series correlate at 0.89 (Pearson’s r). Here is the whole day, straight from the lab’s Splunk:

So the first night was the clean case and the rest of the day was not. Sessions open at an hour boundary explain gaps within the day, but over a whole day they mostly cancel out. What is left is roughly one arrival in six that never shows up as a completed connection. A client that reaches the connectivity check and gives up before any data flows would look exactly like that, and restricted NAT makes that likely. I cannot confirm it from these two counters. Either way it is nowhere near the several-to-one ratio that mass failure would produce.
What it showed
On 29 October the counter saw 193 new clients from 16 countries:
| country | clients | share |
|---|---|---|
| Iran | 99 | 51.3% |
| Russia | 64 | 33.2% |
| Germany | 5 | 2.6% |
| Netherlands | 5 | 2.6% |
| United States | 5 | 2.6% |
| China | 3 | 1.6% |
| Italy | 3 | 1.6% |
| Brazil, Spain, France, Myanmar, Malaysia, Peru, Papua New Guinea, Turkmenistan, Turkey | 1 each | 0.5% each |
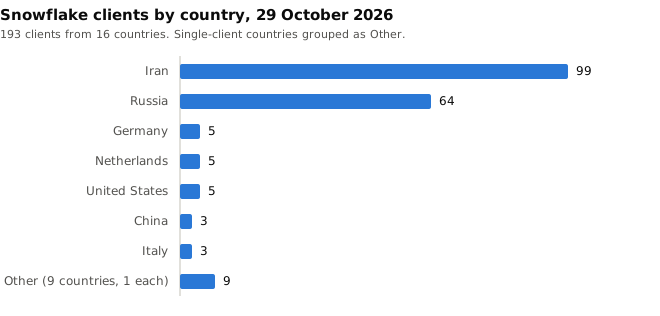
Iran and Russia together account for 84%. Every address had a country in the GeoIP file; there was no unknown row.
The table does not say who caused the morning surge, and it cannot: I do not publish countries by hour. What it does say is that the proxy mostly serves two countries, so the 07:00 Warsaw peak, 09:30 in Tehran, fits Iran. That is consistent with the data, not proven by it.
Concurrency. The socket count gives the figure part one was missing. Over the 96 windows of the day, the largest number of proxy sockets seen open at once was:
| most sockets open in the window | windows |
|---|---|
| 2 (no client) | 29 |
| 4 | 36 |
| 6 | 21 |
| 8 | 10 |
With no client the proxy keeps two sockets open, and every reading was even, which fits two sockets per client. On that assumption the proxy never served more than three clients at once. Even at one socket per client it would be six. Either way it never came near -capacity 10. The counter samples every ten seconds, so a peak shorter than that could be missed, and I have not pinned the two-sockets-per-client step with a single-client test, so the client figures here rest on it.
Everything here covers one full day, 29 October 2026, 00:00 to 24:00. One day is a snapshot, not a trend: in the week before, the proxy’s own counters ranged from 99 to 215 connections a day. Nothing finer than the whole day is published. Every country is listed with its exact count, including those with a single client. That is less cautious than Tor’s own bridge statistics, which round every country up to a multiple of 8. I think it is acceptable for one small proxy and one day with no times attached, but it is a choice, not a rule I can point to.
Keep in mind what this measures: addresses, not people. Many mobile networks put whole neighbourhoods behind one carrier-grade NAT address, and a client on a VPN shows up in the VPN’s country. Tor’s own country graphs have geolocation errors too. In the January 2026 Snowflake operations update, the United States curve fell and recovered together with an Internet shutdown in Iran, which the operators read as Iranian clients being placed in the United States, not as a real change in American users. Any U.S. clients in my count come with the same doubt.
What an adversary would find
The rule from earlier was that nothing left behind should help identify a client. Here is what is actually left, place by place:
| where | what is there | what is not |
|---|---|---|
| the Pi’s disk, or a stolen SD card | the program, the GeoIP file, journal lines with 15-minute counts per country | any address, any hash, the key |
| the log collector and its backups | the same 15-minute lines | any address, any hash, the key |
| this entry | one day’s counts per country | any time finer than the day |
| the counter’s memory, while it runs | the day’s key, hashes of clients seen in the last ten to twenty-five minutes or so, recently freed addresses | nothing someone with that access could not capture live anyway |
The weak spot is the second row. A 15-minute line like “one client from country X at 07:15” is exactly the kind of small, precise number I warned about above, and those lines stay in my log collector as long as its retention keeps them. They add little for a censor that watches its own networks, because it already sees its citizen connect to my address at 07:15. But they are more detail than I need once the day is counted, so coarsening them to hourly, and keeping the fine view on the Pi alone, is the one open gap in the rule above and the next change I will make.
What I would check first next time
What a field actually counts. Both impossible numbers in the digest came from comparing a field with a limit it never measured. The field names were mine, and part one had already explained the difference between connections per window and concurrency. Three raw lines would have saved an hour.
Anything I think I remember about the machine. Six steps of this design rested on things nobody had read from the Pi: that the proxy had a metrics flag, that ss would show each client as a socket’s peer, that the journal was volatile, that the GeoIP package installs on its own, that inet_aton is a safe parser, and two figures taken from a quick reading. Each was wrong, and each fell to one check (-help, ss, an earlier record, apt-cache show, a test, a recomputation) before it reached a running service or this text.
Whether a limit is enforced, not whether it is set. The one lesson here that travels beyond this box: ask the kernel, not the config.
The default paths, before the clever part. Counting in RAM was never the hard bit. The danger was stderr going into the journal and the journal going into an index, which happens unless you stop it. Taking the address from somewhere it is never logged removed that whole problem.
An independent count. Without the hour-by-hour comparison, the country table would rest on my trust in a packet filter. With it, the same check also answered most of the question that started all this, and showed where it stops: about one arrival in six that the proxy never counts as a connection.
Upstream. The proxy has counted countries itself since 2.11.0. I only looked at the changelog after building my counter. The counter still has a use for packaged proxies and gives a concurrency figure the built-in one does not, but I should have looked first.
Should you do this?
An IP address is personal data under the GDPR, and looking one up in RAM for a second is still processing it. Doing it in memory and keeping only aggregates is a strong data-minimisation argument. Whether that is enough for a service run for strangers is a question for a lawyer, and I am not one.
If all you want is the concurrency figure, skip the address entirely: counting sockets in the proxy’s port range needs no address at all.
Is Snowflake any good, then?
Yes, at the one thing it is for. Snowflake gets a user in a blocked network to Tor at all: proxies are thousands of volunteers whose addresses churn, so there is no stable list to block, and on the wire the traffic looks like a video call. That half my clients sit in Iran and a third in Russia is the design doing its job.
It is not a layer of anonymity on top of Tor. A proxy operator sits where a bridge operator sits: they see your address and that you use Tor, and nothing of what you do. The danger is a user who reads “I got through” as “I am hidden”.
If you are the one using it
- Treat Snowflake as access, not cover. The entry hop always sees that you reached Tor. Where that fact alone is the risk, Snowflake does not answer your threat model.
- Protect what you do downstream. Run Tor Browser as shipped and never sign in to anything that identifies you in the same session. That is where people actually get deanonymised, whichever proxy they came in through.
- If your adversary watches both ends, no entry transport saves you. That is the standing limit of low-latency anonymity, not a Snowflake defect.
An honest operator and a censor’s operator sit in the same chair and see the same packets. The only difference is what is left once the packet is gone, and here that is 193 clients, most of them in Iran and Russia, and nothing about which one was which.
Sources
- Tor Project: Snowflake
- Tor Project: Snowflake ChangeLog (
-metricsin 2.7.0; country label in 2.11.0, as listed in openSUSE’s package changelog) - Tor Project: Snowflake merge request !142 (Prometheus metrics for the proxy)
- Tor Project: Snowflake issue #33157 (how
client_iptravels from proxy to bridge to tor) - Tor specifications: Extra-info document format (
bridge-ips, rounded up to a multiple of 8) - IETF: RFC 8489, Session Traversal Utilities for NAT (STUN) (the magic cookie, section 5)
- IETF: RFC 6347, Datagram Transport Layer Security Version 1.2 (the record header, section 4.1)
- tcpdump: pcap-filter(7)
- Debian: tor-geoipdb package
- Tor Project forum: Snowflake Daily Operations, January 2026 update
- systemd:
systemd.exec(capabilities,LimitCORE=)