I timed EPSS against CISA on 204 exploited CVEs. It mostly forecasts yesterday's rain – part 2/3
Part two of the Rappaport series. The signal a CVE triage pipeline leans on hardest, the probability that a vulnerability will be exploited, timed against CISA's catalogue on every CVE published in 2026 and since listed, and against a few weeks of the pipeline's own lab runs.
Scope: cve-digest v0.7.26 on a single home-lab host, 16 October to 3 November 2026; EPSS history from FIRST's API and the CISA KEV catalogue as of 30 October 2026.
Method: FIRST's EPSS history read day by day for every CVE published in 2026 and in CISA's KEV catalogue as of 30 October 2026, plus cve-digest verdicts from one home-lab host, 16 October to 3 November 2026, read from the lab's Splunk.
Contents
Part 1 ended on a claim it could not yet settle: on the day a CVE is published there is almost nothing to rank it by, unless it arrives already loud, so the design problem is asking again on later runs. Ten days was an anecdote. This is the claim measured over longer, and the finding is uncomfortable: the signal the whole architecture leans on, the probability a vulnerability will be exploited, stayed silent.
Silence can mean three things. The signal is right, and almost nothing published today will be exploited. The signal is early, read before the evidence it is fitted on exists. Or the thresholds are wrong, set against a distribution that never occurs on day one, so the second tier is empty by construction. Only the last is a fault in the design, and only data tells the three apart.
Rappaport, the pipeline’s namesake, is one of the scientists in Stanisław Lem’s His Master’s Voice, a novel in which a team reading meaning into a signal from the stars slowly learns that the meaning tells them more about themselves than about the signal. The warning is against a reader in a hurry who fills a silence with himself. Part 1 pointed it at the feed. This one points it at the instrument. When your own main signal goes quiet, the honest move is to go back to the assumption the ranker was built on and measure whether it holds.
Terms used below
| Term | What it means |
|---|---|
| CVE | A public identifier for one known vulnerability, assigned by a CVE Numbering Authority (CNA), often the vendor itself. |
| CVSS | A severity score from 0 to 10. It says how bad a vulnerability would be if exploited, not how likely it is to be exploited. |
| EPSS | A daily probability from FIRST, between 0 and 1, that a CVE will see exploitation activity in the next 30 days. |
| KEV | CISA’s Known Exploited Vulnerabilities catalogue, the list of CVEs with evidence of exploitation in the wild. |
| P1 to P3 | The pipeline’s priorities, from the top tier down. P1 and P2 together are the act-today tier; P2, the second tier, is the one that pages an analyst. |
Where the signal comes from, and why it is late
Four bodies produce the signals the pipeline ranks on, and only the first moves at the speed of publication. A CNA assigns the identifier. NVD enriches the record with a severity score and the identifiers that say what it affects. FIRST computes the exploitation probability, EPSS. CISA lists the vulnerability as known-exploited if and when there is evidence it is being used. The identifier lands on day one. The rest arrive later, each on its own clock, and the first thing a pipeline reading fresh CVEs learns is how much of the record is still blank.
That lag is no longer a backlog that clears. In April 2026 NVD said it could no longer keep up with the volume of new CVEs and moved to risk-based enrichment: it now enriches only what CISA lists as exploited, software the federal government runs, or software designated critical, and marks everything else “Not Scheduled”. The pre-March-2026 backlog is being moved into that bucket in batches. The cause is volume. CVE submissions rose 263 percent between 2020 and 2025, NVD enriched nearly 42,000 last year, 45 percent more than in any prior year, and the first quarter of 2026 came in nearly a third higher than the one before. Part of the new volume is attributed to AI-assisted vulnerability discovery. Part 1 named that flood in passing. It is now the stated reason the authority of record has stopped scoring most of the catalogue.
The vendors already route around it. Red Hat, among others, has for years published its own per-CVE security data rather than wait on NVD, as machine-readable CSAF VEX with its own ratings and an affected-or-not status per product. I know the gap is real because I spent most of a Red Hat product-security interview arguing about it. The internal candidate surfaced about fifteen minutes in, so the rest was two people enjoying the problem ¯\_(ツ)_/¯. The gap outlasted the interview, and NVD’s retreat makes official what those vendors already treat as permanent.
On this corpus the routing-around works. Of the 3,846 records the pipeline ranked over ten days, 3 had no severity score at first ranking, most likely because the CNA that assigned the identifier supplied one. 3,449 had no exploitation score.
What Part 1 left open
Start with the arithmetic. The non-KEV scoring formula puts the second tier, the one that pages an analyst, at forty points. At the top of the CVSS range and full asset weight, reaching forty requires an exploitation probability of 0.280. At a CVSS of 7.0 it requires 0.364. Down-weighted items need more. Computed item by item against its own CVSS and weight, over one measured day of 878 records, not one reached the probability its own tier required. The lowest bar anywhere in that corpus was 0.280. The highest probability the model returned for any item was 0.02, an order of magnitude short. The exploitation term contributed at most 1.2 points out of the forty a second-tier item needs. Ranking that day was, in effect, binary: known-exploited or not, with severity deciding the order underneath.
Ten unattended days said the same thing at scale. The pipeline ranked 3,846 records, one per CVE, and for 3,449 of them the exploitation score had not yet been published. The 397 that had one all sat below 0.02. Measured against its own CVSS and weight, not one record carrying both signals came within reach of its second-tier bar. The lowest bar among them was 0.282. The highest score was 0.0126. Not one record reached either of the top two tiers.
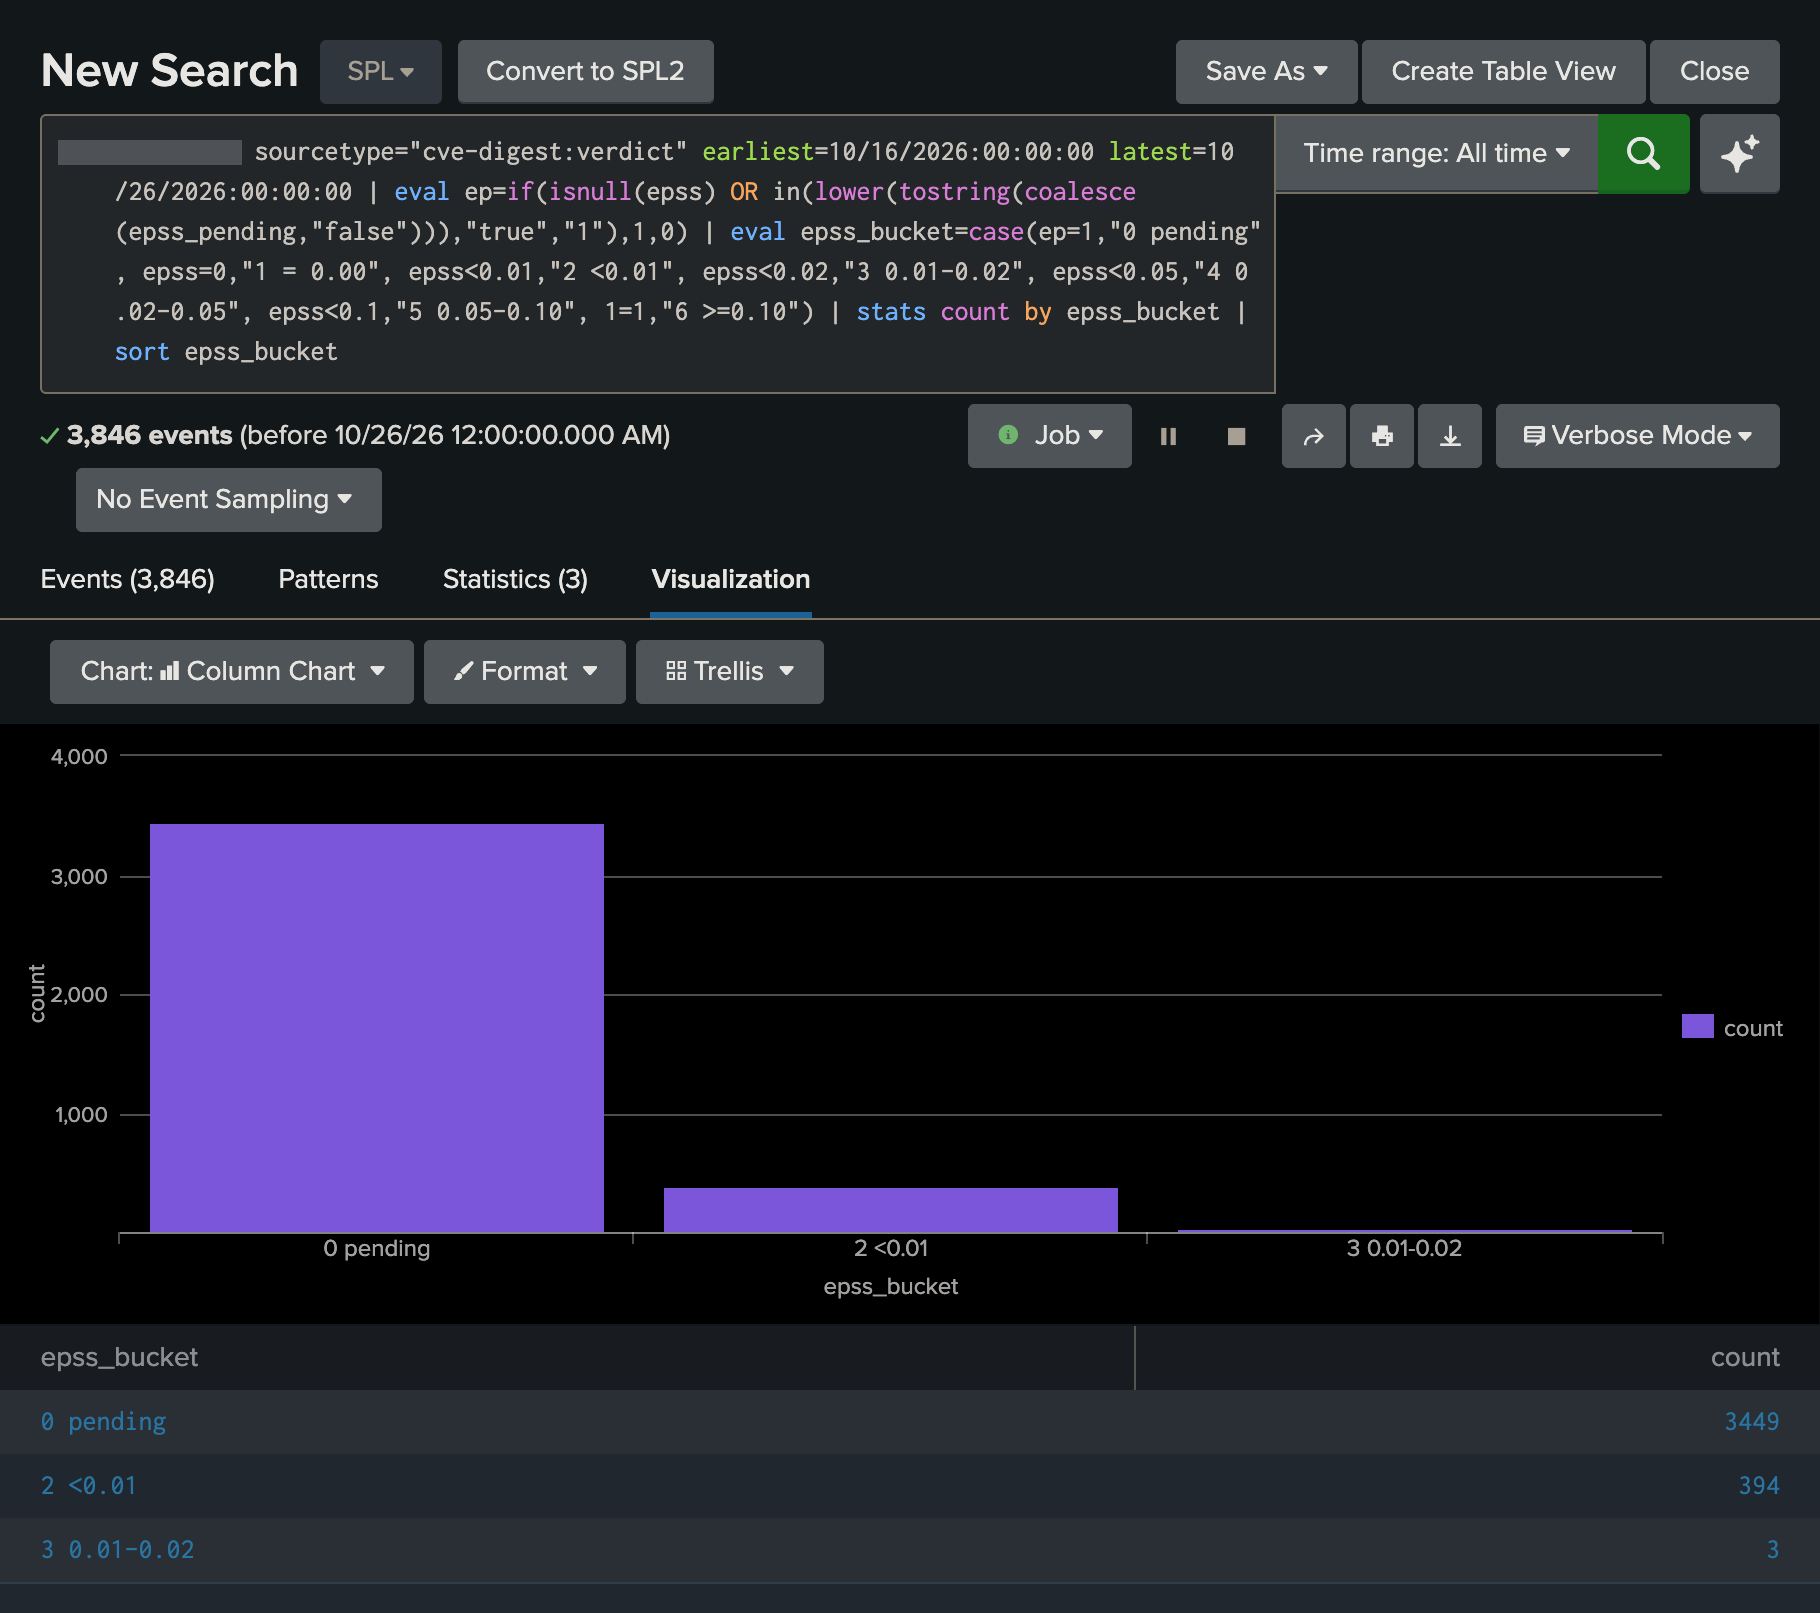
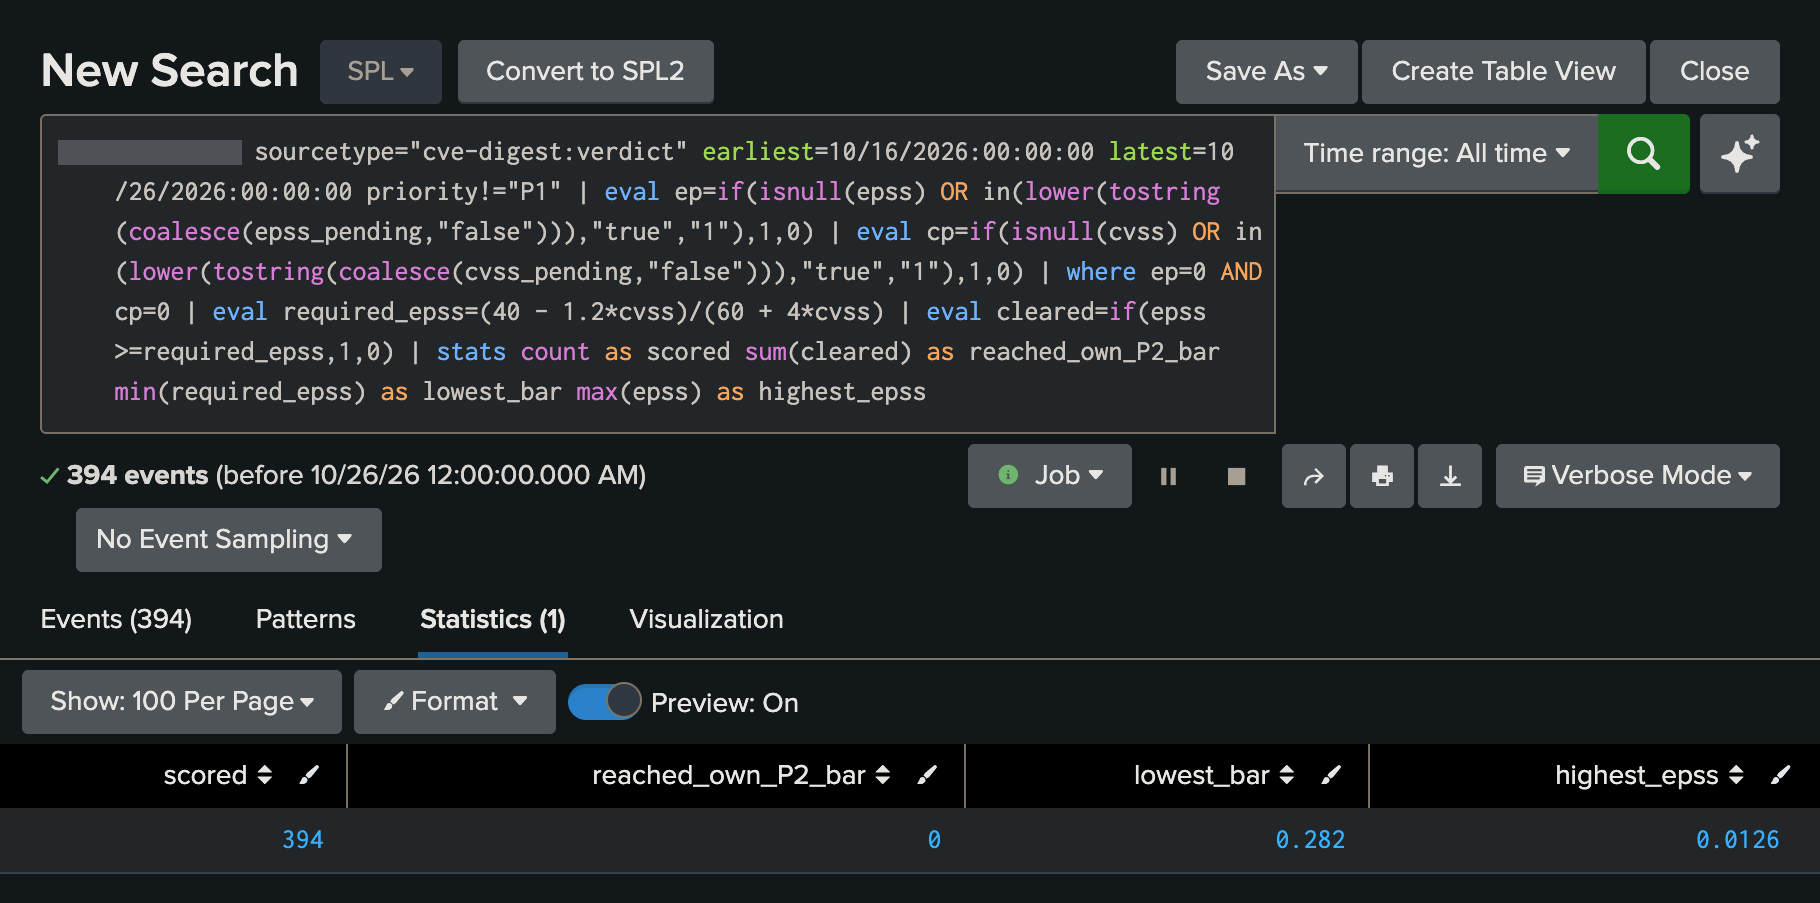
So the question is which reading that supports.
A scorecard against a plain CVSS threshold
On the single measured day the four policies split the same 878 records as follows: everything published, 878; a CVSS of 7.0 or more, 505; a CVSS of 9.0 or more, 98; the pipeline’s act-today tier, one. Over ten live days the severity share held near half, 1,887 of 3,846 at CVSS 7.0 or more and 369 at 9.0 or more, against an act-today tier that stayed empty. A severity filter hands over about half of every day’s records, and the queue grows.
Does the exploitation signal move before CISA?
The catalogue of known-exploited vulnerabilities is the one signal that lifts an item on its own, and the last to arrive. Barracuda put the median gap from a CVE’s publication to its KEV entry at fourteen days for 2026 through July, up from six in 2023. Counting new bugs only, published from 2022 on, I get nine days on the catalogue as it stood on 30 October. I have not reconciled the two figures. The windows differ, and the counting may too. Either way, the pipeline re-reads the catalogue every run to catch the entry when it lands. The open question is whether the exploitation probability would have caught the same items earlier.
The test is easy to state. Take every CVE published in 2026 that CISA has since listed, 204 of them. Read each one’s exploitation score day by day from publication, from FIRST’s own history, and ask whether it crossed 0.28, the lowest second-tier bar anywhere, before the catalogue entry.
53 of them, about a quarter, were listed on the day they were published or before, so no score could lead.
Of the 151 that had a window, 11 crossed the bar before CISA listed them. 42 crossed only after. 98 had still not crossed it two weeks after the entry. The day before listing, 127 of them had a score. The median was 0.005, and 81 sat below 0.01. Measured against each item’s own bar, set by its CVSS, 9 of the 136 that carried one crossed first.
140 of the 151 crossed the bar only after CISA listed them, or not at all.
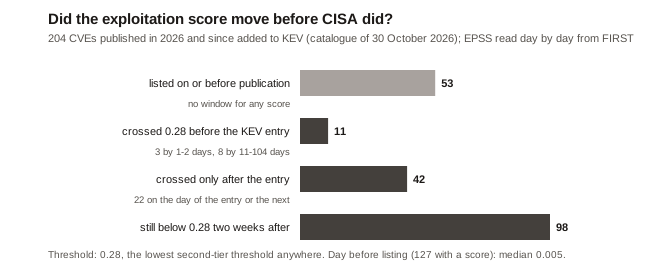
Of the 42 that crossed after, 22 did so on the day of the entry or the day after, twenty of them exactly one day after. That is a forecast of yesterday’s rain. The likeliest reading is that the score reacts to the same public evidence of exploitation that puts an item in the catalogue.
The eleven that led split cleanly in two. Where CISA listed within two weeks of publication, 89 items, three crossed first, by one or two days. They are the three Part 1 followed through the lab. Where CISA took longer, 62 items, eight crossed first, by 11 to 104 days. Three of those eight crossed on 15 June, the day a new version of the model went live, so their head start most likely dates from the model change rather than from anything new about the vulnerability. The 104-day lead is a single day above the bar, months before the entry. Four leads remain.
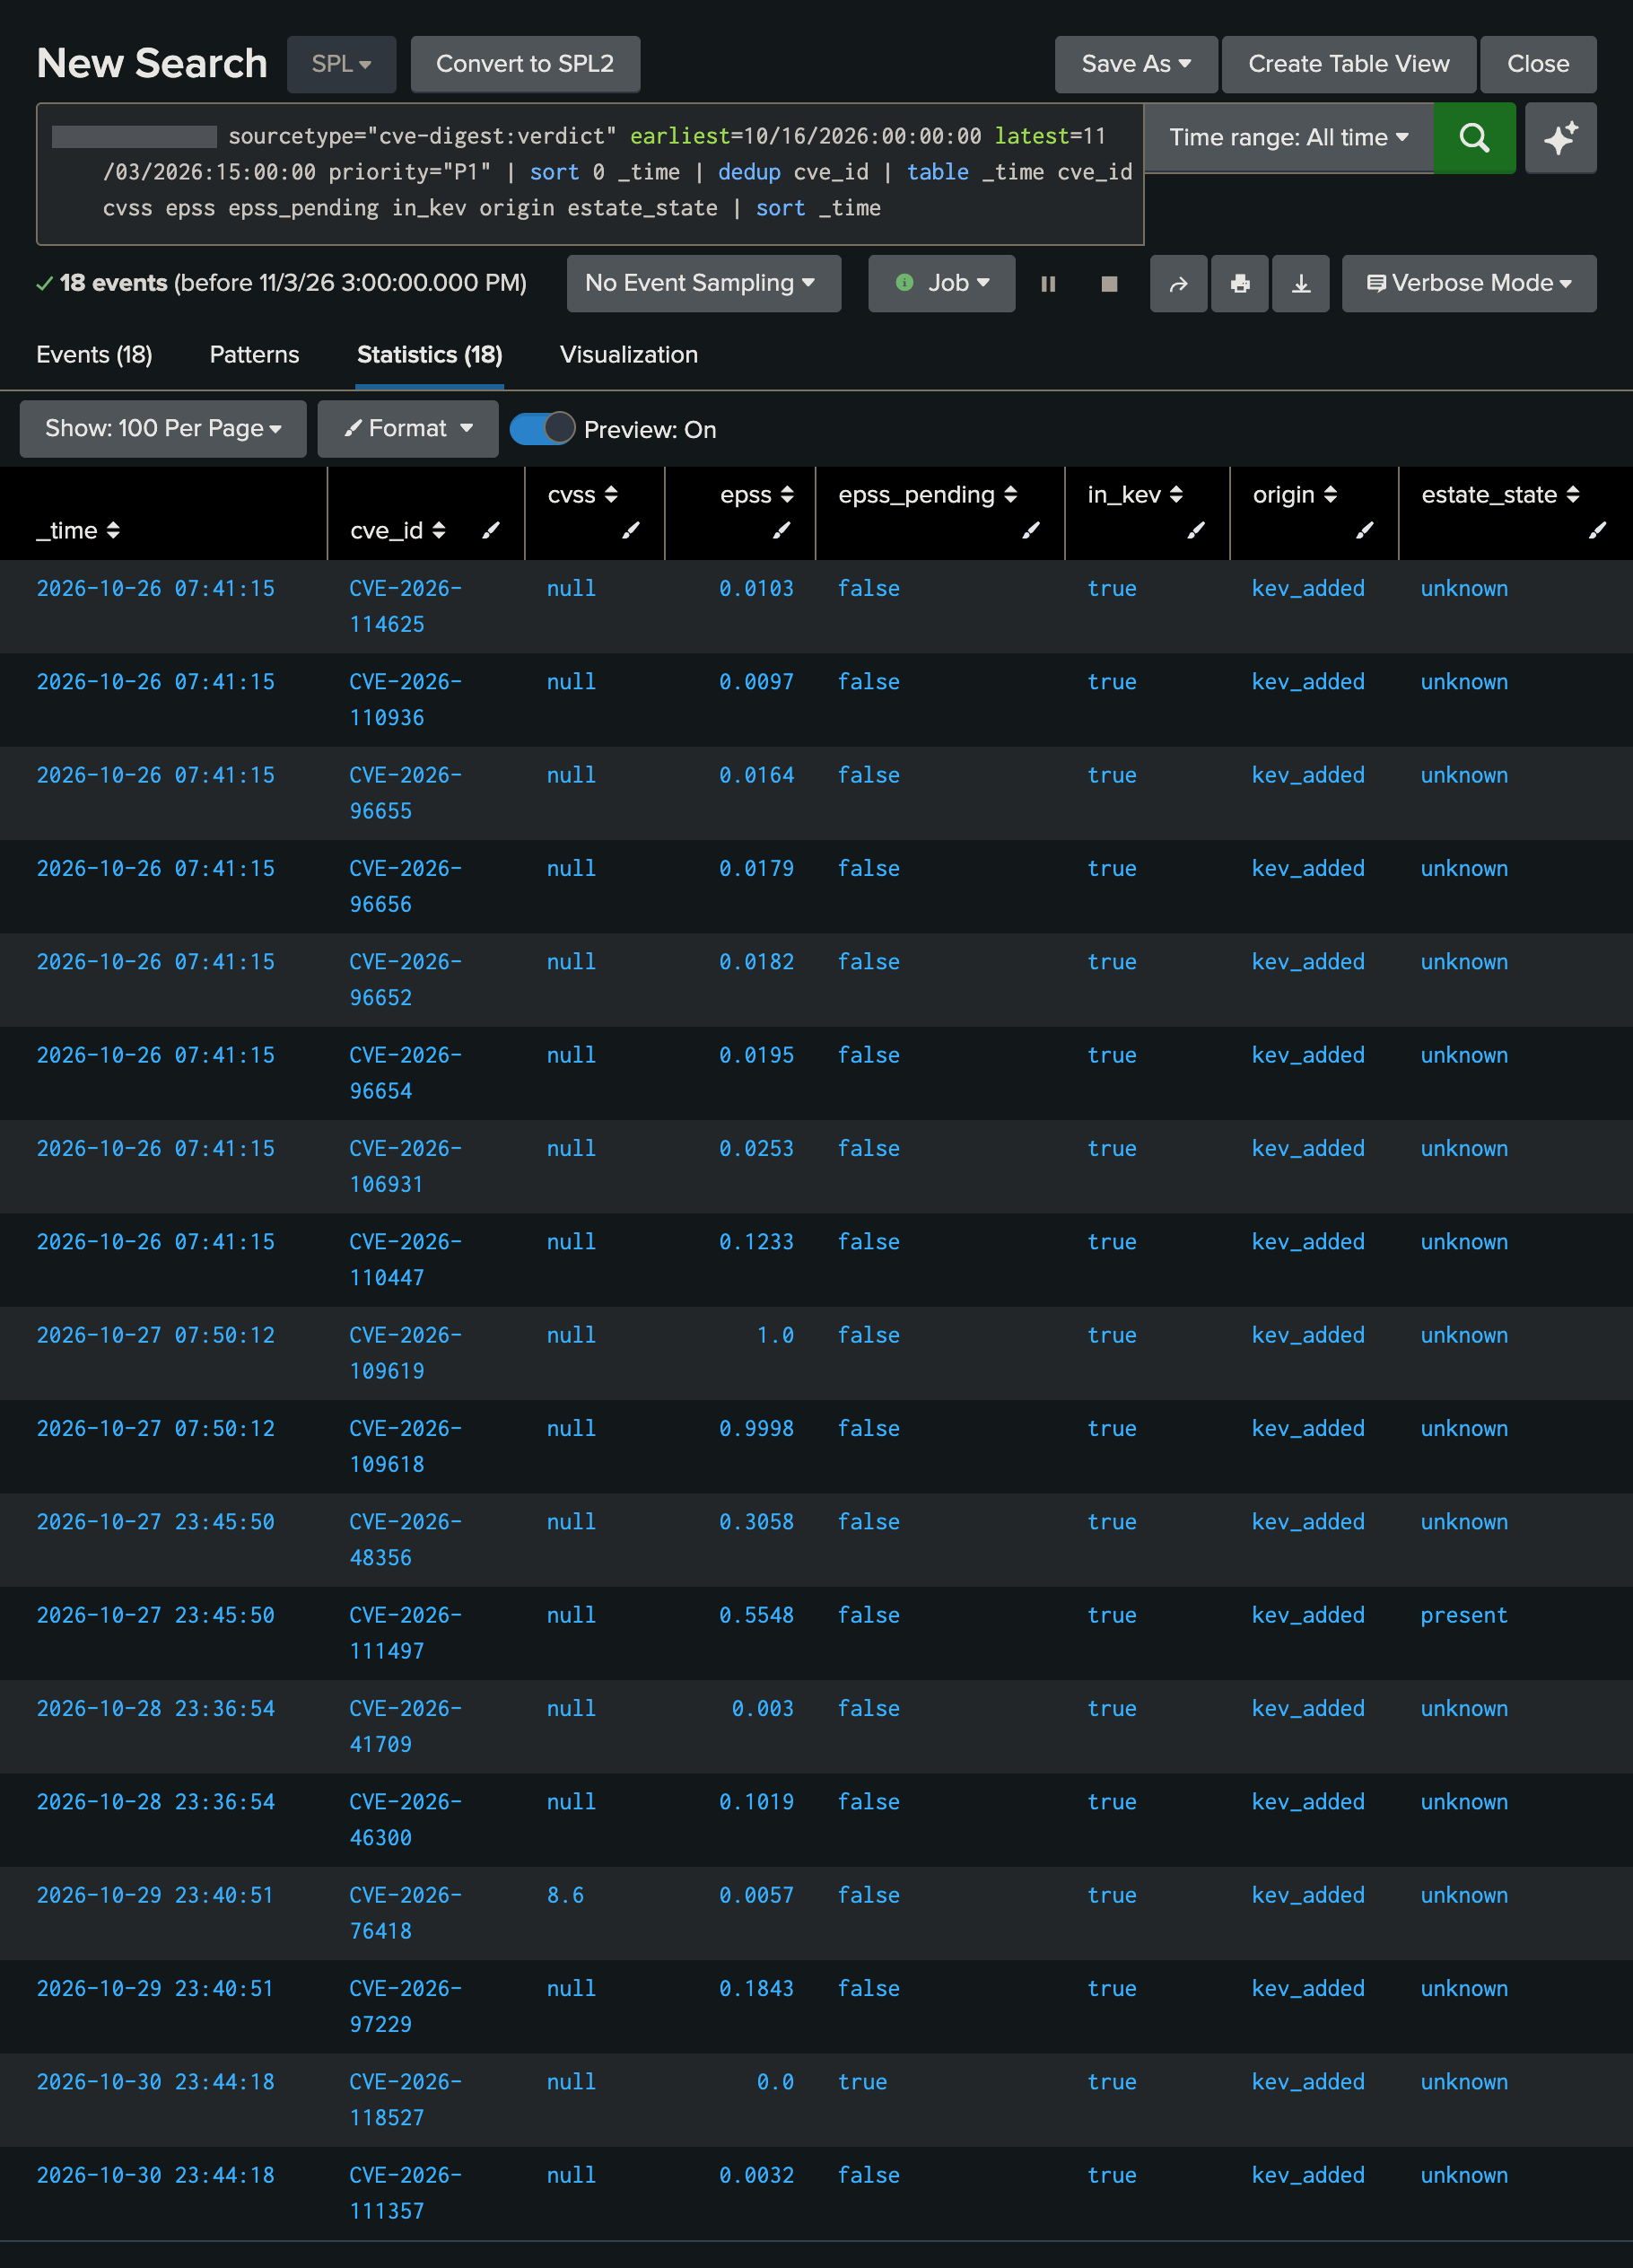
The lab shows the same thing at its own scale. Since 16 October, 18 items reached the top tier, every one through the catalogue. Thirteen carried an exploitation score below 0.28 at the moment they were ranked, and one had none yet. The four above it were CVE-2026-109618 and CVE-2026-109619 at the ceiling, CVE-2026-111497 at 0.55 and CVE-2026-48356 at 0.31.
The floor that misfired
When the primary signal says nothing, it is tempting to find a secondary one, and the pipeline did once. The estate floor was built so that a component you actually run could raise a vulnerability’s priority even when its exploitation score was silent, with presence standing in as a weak signal of relevance. The lab measured how often that misfired.
On the lab’s production configuration, the branch where the floor lifted a present component into the second tier while its CVSS was still pending accounted for 71 percent of everything in that tier, at a median exploitation-score percentile of six. Nearly three in four of the items the pipeline was paging a person about came from a rule firing on components whose exploitation signal sat in the bottom tenth. Across a week the floor as first built produced 169 second-tier items. Restricting it to fire only on a published CVSS of 7.0 or more cut that to 49. The restricted version shipped. In the last live week it produced 16, and nothing else reached the second tier. All sixteen carried their CVSS from the first run. What arrived later was the inventory match: each was first ranked with its estate state unknown and rose when a later run found the component present.
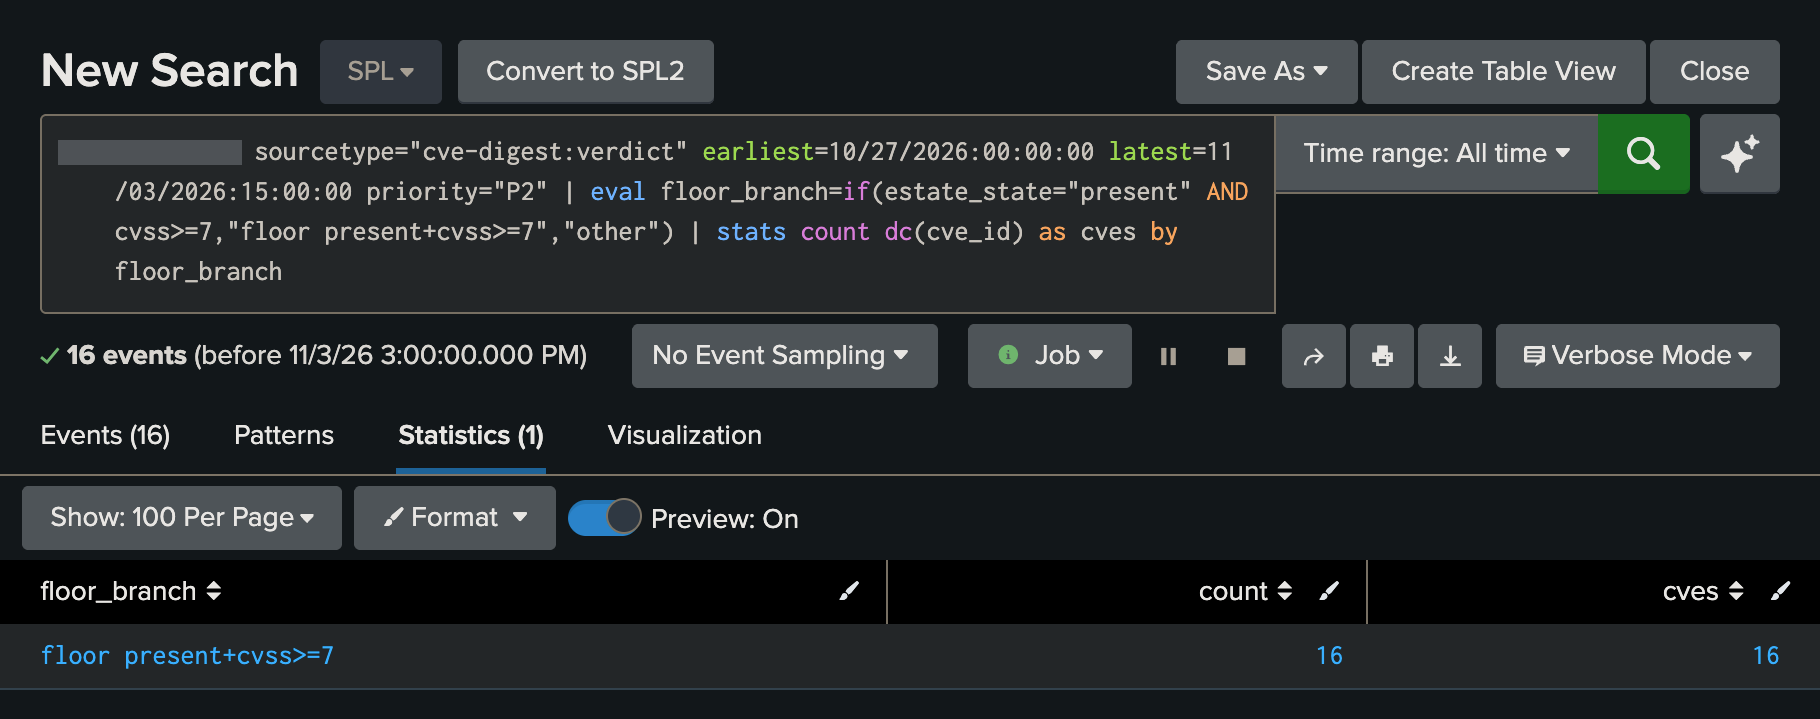
The scale of the misfire is clearest in one comparison. In a single window the floor promoted 168 items whose exploitation scores summed to 0.363. In the same window, the mechanism that re-scores items as their exploitation signal arrives caught three items crossing into the top tiers, and those three summed to 2.33. One rule lifted fifty-six times as many items on less than a sixth of the exploitation signal. A rule that can only raise a priority still needs a false-positive budget, written down and defended like any other rule.
Which reading the data supports
The signal does arrive, after the pipeline has ranked and moved on. In an earlier backfill, a publication window re-read a week later was missing the exploitation score for 131 of 4,075 records, 3.2 percent, against nearly nine in ten on the day.
That would be enough if the score still arrived before the catalogue. The lead-time count says it does not. When the score arrives, the catalogue has usually arrived with it or before it, and a re-ask that brings back a number CISA has already acted on changes no ranking. Nor is the signal right, in the sense that matters here. The items CISA was a day away from listing sat at a median of 0.005.
That leaves the third reading. On this corpus the second-tier bar sits where only items the catalogue already lifts ever reach it. The exploitation route into that tier is empty by construction. That is the fault in the design. Moving the bar is a design change: a false absent scores 39.6 today, a notch under the 40 that would surface it, and any move has to re-read that value in the same change.
Re-asking still earns its place: what it brings back is catalogue entries and inventory matches.
Compared with what people already run
Where does it sit among the tools a team already runs, and what does it leave for them to do?
| Rappaport | Threshold script (KEV + EPSS, ~20 lines) | Dependency-Track | Scanners (Trivy, Grype) | |
|---|---|---|---|---|
| Question it answers | Of what published or changed since the last run, what deserves a person first, and why | Of what carries a score now, rank it | What in my inventory is affected right now | What is in this artifact, and what of it is known-vulnerable |
| On the day of publication, no signal yet | Holds the item in review and asks again next run | Ranks what it has; the rest falls out | Surfaces the component when a source later matches it | Reports what the feed already knows |
| Re-asking as signals arrive | KEV re-read every run, a 14-day P3 watch, a review recheck | None | Re-matches the inventory the moment sources update, not on a periodic scan | On the next scan |
| The LLM | Summarises the top tier and nothing else; priority is decided in code before it runs | None | None | None |
| Inventory and estate | Optional, through an SBOM and OSV, with explicit unknown, uncovered and absent states | None | Its core: a continuously updated CycloneDX inventory across NVD, OSV and GitHub advisories, with EPSS, VEX in and out, an audit trail, and policy gates that break a build | Only the artifact it scanned |
| Shows its reasoning | Prints the derivation rule by rule, including the rules that fired on nothing | Read the twenty lines | A permanent, exportable audit trail with analysis state and justification | A list of findings |
| What it is to run | One Python process and a SQLite file | A script | A service backed by PostgreSQL, active/active and highly available | A binary, once per scan |
Dependency-Track is the mature platform in that column, and the table understates it: coverage across many sources, a real triage workflow with a permanent audit trail, VEX both consumed and produced, and a Common Expression Language policy engine that can break a build on a fail. It answers the standing question, what in an inventory is affected right now. Rappaport answers a daily one, what in today’s feed deserves a person first, and the two coexist: the pipeline reads its inventory as CycloneDX, the format Dependency-Track exports.
In a pipeline, Rappaport sits after whatever builds the inventory and before whatever cuts the tickets, and takes no action itself. Its closest neighbour is the threshold script, which ranks what has a signal. On the day of publication, most records have none.
What a few weeks still do not show
A few weeks of data from one lab under one operator is a small sample. The numbers here are directional and rounded down on purpose. The scorecard measures the pipeline against its own tiers. Only the lead-time count measures against an outside record, and that record is the catalogue, which is itself late and lists only what someone has seen exploited. The lead-time count rests on one year of entries and two generations of the exploitation model: the March 2025 model was replaced with a new one on 15 June 2026. Four dates carry three or more simultaneous crossings, 15 and 23 June, 24 July and 25 October. The first is the day the new model went live, and the lead-time section sets its three crossings apart. The other three fall inside a single model. Nobody has measured the time an analyst spends on the review lane. That is the number that would turn any of this from arithmetic into evidence. Until someone does, the saving is unmeasured. Estate coverage reaches as far as the public vulnerability database can speak and no further, which today leaves most known-exploited entries without a matching record. And the clearest finding in the piece counts against the tool: on this corpus the exploitation score, the signal the whole design leans on, does not carry the weight the design assigns it.
Back to the instrument
Lem’s reader in a hurry fills a silence with himself and calls the result a message. This piece pointed that warning at the pipeline, and the pipeline came off no better. For a few weeks its main signal said next to nothing, and the first response was a floor that accounted for seven in ten of the second tier. Measured, the silence turned out to be lateness: the score arrives, mostly after the catalogue it would have to beat. An instrument worth trusting is one that can report its own silence and then go and find out why.
Sources
- NVD’s move to risk-based enrichment: Socket, “NIST officially stops enriching most CVEs”, April 2026, consistent with NIST’s own announcement of the same month. The volume figures (submissions up 263 percent from 2020 to 2025, nearly 42,000 records enriched in 2025, the first quarter of 2026 nearly a third higher) are as reported there.
- Vendor security data: Red Hat, VEX files for CVEs, generally available.
- Dependency-Track’s capabilities as listed on dependencytrack.org/features, read on 3 November 2026.
- The KEV lag and its trend: Barracuda, “The KEV gap: how fast do exploited bugs get flagged?”, July 2026. A vendor analysis: six days in 2023, nine in 2024, twelve in 2025, fourteen in 2026 to July. My own nine days are counted on CISA’s KEV catalogue as of 30 October 2026.
- EPSS model versions, from the header line of the daily EPSS score files (epss.empiricalsecurity.com): v2025.03.14 up to 14 June 2026, v2026.06.15 from 15 June.
- The lead-time count is my own: every CVE published in 2026 and in that catalogue, with its EPSS history read day by day from FIRST’s EPSS API.
- Pipeline figures: the ten-day window (16 to 26 October), the top-tier list and the last week are from the lab’s Splunk, read on 3 November 2026; the screenshots show each query with the index name blanked. The one-day figures (878 records) come from a laptop run of the same pipeline, the estate-floor figures from a lab rehearsal, and the week-later re-read from an earlier backfill.