Apple's own endpoint sensor, without an agent
Part one of Agentless macOS. Endpoint telemetry from a personal Mac with nothing installed but what Apple ships: eslogger, a small filter, a forwarder and a Splunk index. What nineteen days of one Mac cost to watch, what the sensor recorded about its own blinding, and the two rules that came out of it.
Scope: One MacBook Air (M3, 2024) on macOS 27.2, no MDM; eslogger under launchd with 41 event types, es-filter and a Splunk Universal Forwarder to a home-lab Splunk; 16 October to 4 November 2026.
Method: Unique events in one Splunk index from 16 October to 3 November 2026, cross-checked against the filter's own heartbeat counters; the rule on the sensor losing its access was fired by a deliberate test on 4 November.
Contents
I went looking for the best way to monitor the security of my personal macOS environment, and it turned into an in-depth investigation of how much eslogger can tell about a Mac. The environment has three Macs in it, and I started with one. The one this series begins with is a MacBook Air (15-inch, M3, 2024), which goes everywhere with me. It carries my work: the code I am working on, my research, the security events I review, architecture work and some limited penetration testing, along with confidential findings that could do harm in the wrong hands. It carries the rest of my life too, and some of other people’s. On it I talk to prospects and customers, message everyone I know, the people closest to me included, keep a journal, read about things that touch on how I am doing, and edit documents I would not want anyone else to open. (While working on this piece I was arranging an appointment with my dentist on it.) That puts almost everything personal on one machine. That is where my doubts about installing more software on it came from. The other two are the next steps of the investigation. The second is a Mac Studio M5 Ultra that I am setting up as a local AI workstation, where monitoring is closer to watching a hypervisor that runs large local models. The third is an Intel MacBook Pro (16-inch, 2019) with an i9 and 32 GB of memory, a useful contrast, because an Intel Mac still loads third-party kernel extensions without lowering its boot security. Both will join the investigation later in the series.
Two ends of the market
I know the XDR end of the market from my professional experience: CrowdStrike Falcon, SentinelOne and Microsoft Defender well, Palo Alto’s Cortex XDR from a proof of concept. For the Macs I have at home they felt overengineered. They tend to be a better match for corporate environments, and they are built around a corporate fleet from the start. Each of them is run from a SaaS console, and the console’s model shows it. In CrowdStrike’s, prevention, sensor updates, firewall, device control, response and content updates are among the separate policy types, each attached to host groups and ordered by precedence. Uninstall protection lives in the console too: removing the sensor takes a maintenance token issued there, which makes sense when the user and the administrator are different people. On a Mac, deployment assumes device management. Microsoft’s Intune guide for Defender for Endpoint on macOS walks through about ten configuration steps, eight of them permission profiles for the system extensions, the network filter, Full Disk Access, background services, notifications and more. Full Disk Access granted that way does not show up in System Settings at all and cannot be revoked there. CrowdStrike sells its smallest bundle, Falcon Go, per device for up to 100 devices, and its bundles page lists EDR only in the Enterprise tier. Microsoft does sell Defender to individuals, inside Microsoft 365 Personal and Family, but as an anti-malware app rather than the EDR it sells to businesses. At the other end sits classic antivirus. On macOS it largely duplicates XProtect, which Apple already ships, and it is built first around recognising files already known to be bad. Shipping that protection with the system is a policy Apple deserves credit for, and XProtect is more capable than its low profile suggests. It checks apps against YARA signatures when they are first launched, when they change on disk and when the signatures update, and Apple delivers new signatures on its own schedule, independent of system updates. A second engine removes infections it recognises and keeps checking the Mac periodically, and Apple also describes a third that looks for unknown malware by its behaviour.
Then again, I am not a typical home user. Among other things, I work on the enterprise side of this market, deploying and running EDR on large fleets and building detections on top of it, and the rest of my work covers cloud security and security more broadly. At home I run a lab with honeypots exposed to the internet and production services of my own in the cloud, so my exposure is wider than that of someone whose biggest risk is a phishing link and a fake payment page while shopping on eBay. This series is written for an EDR engineer at a large company, for a developer or DevOps engineer worried about the security of their own garage lab, and for any tech bro (or sis) curious what their Mac gets up to when nobody is watching.
Where security software sits
Antivirus has to sit somewhere in the system too, and where it sits has changed. For most of the Mac’s history, security products worked from inside the kernel. They loaded kernel extensions (kexts) that hooked Apple’s KAuth interface or the unsupported MAC framework, or they read the OpenBSM audit trail, and a kernel extension, once loaded, holds every privilege the kernel has. In 2019, with macOS Catalina, Apple introduced Endpoint Security as the supported replacement for all three and began deprecating kernel extensions in favour of system extensions that run in user space. Apple silicon pushed further: on an M1 or any later Mac, a third-party kernel extension loads only after the owner lowers the boot security from recovery. Windows started down the same road later, and under pressure. On 19 July 2024 a faulty content update for CrowdStrike’s Falcon sensor, which runs in the Windows kernel, took down about 8.5 million Windows devices by Microsoft’s estimate. Microsoft answered with the Windows Resiliency Initiative and a platform that lets security products run outside the kernel, shown to vendors as a private preview in 2025.
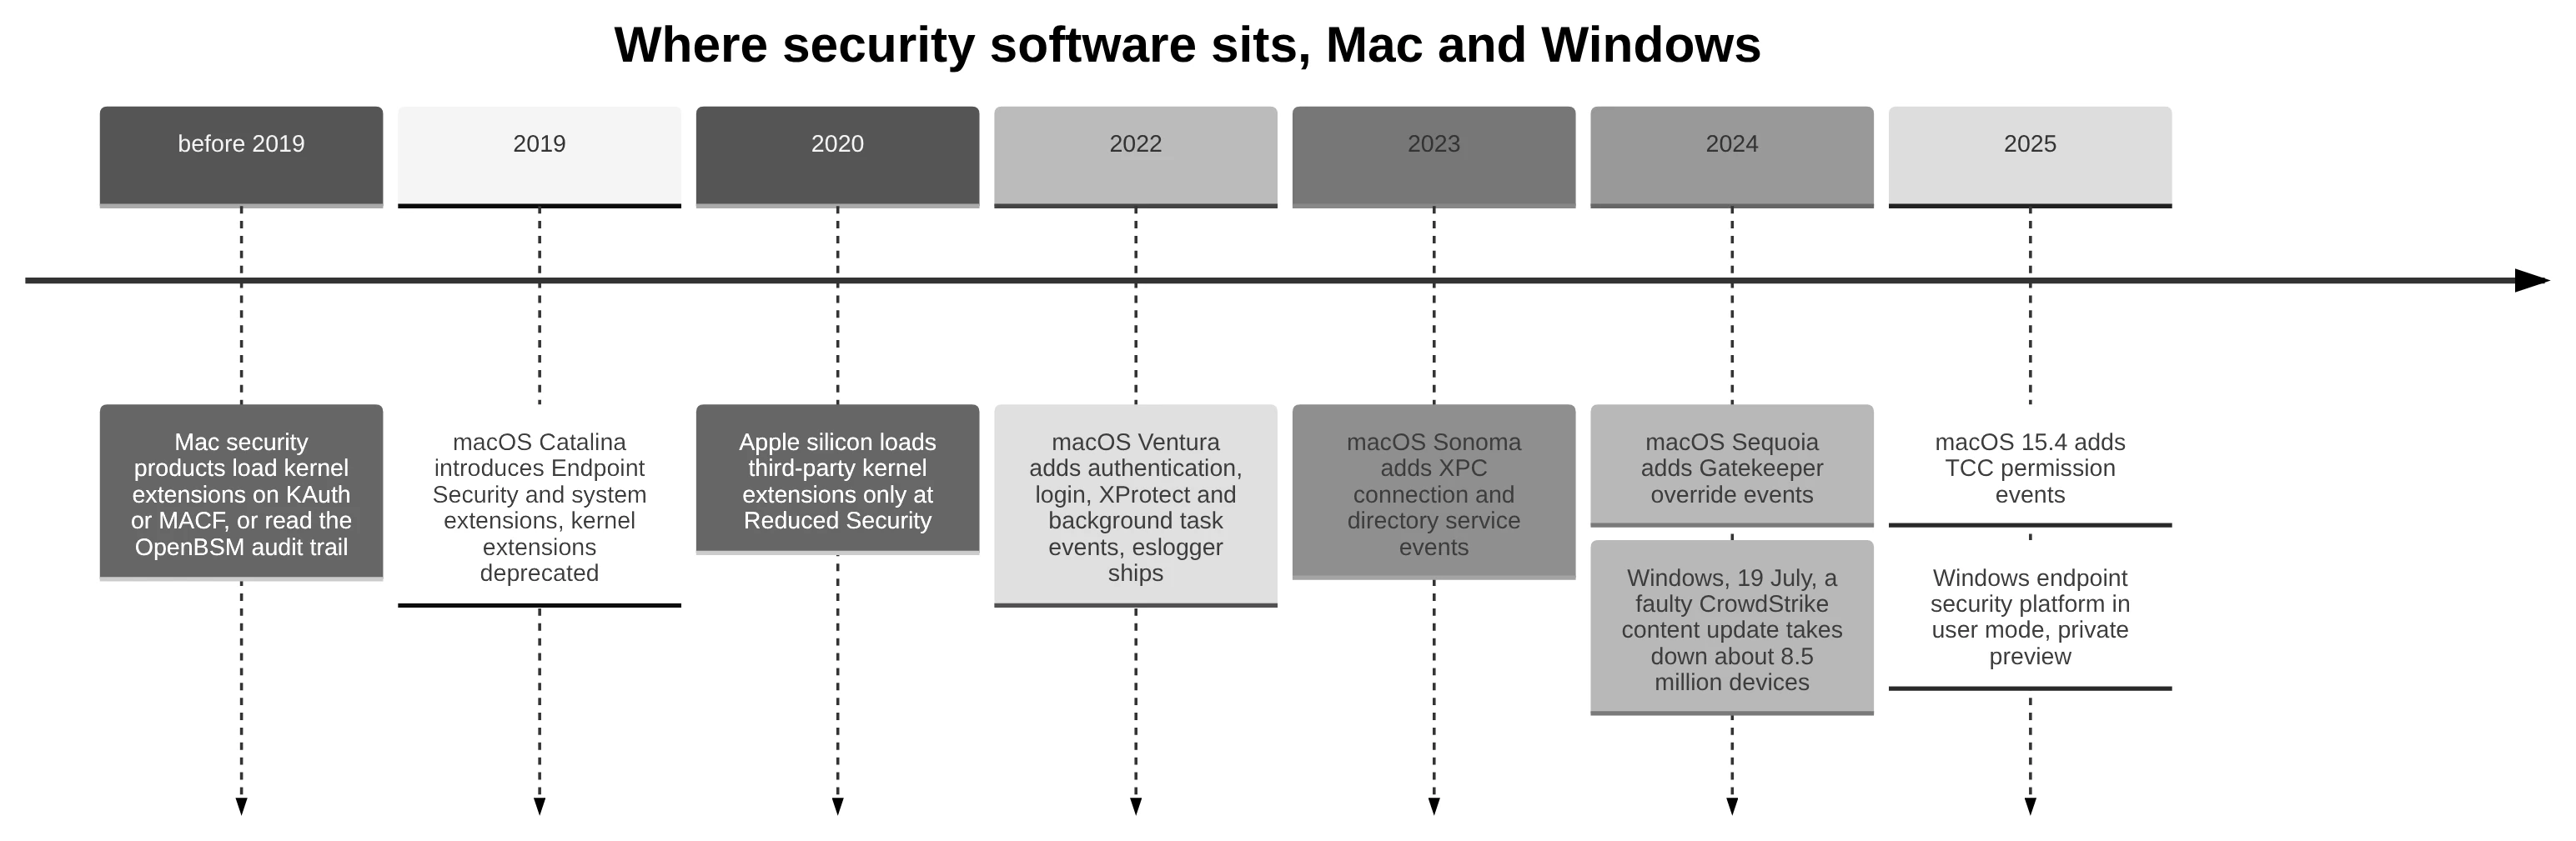
A current Mac antivirus therefore runs as a system extension built on Endpoint Security, and that seat is still privileged. Through authorisation events such as ES_EVENT_TYPE_AUTH_EXEC and ES_EVENT_TYPE_AUTH_OPEN, the product is asked before a program starts or a file opens, and it can refuse. Every such question carries a deadline, and the system terminates a client that misses it, so the product sits on the path of every launch it is subscribed to. Through Full Disk Access it can read every file on the disk, my journal included. Some products also send suspicious files to the vendor for analysis, and ESET’s Mac client keeps a list of the files it has sent.
Between the two ends sit free, open-source tools from Objective-See: BlockBlock, which watches for new persistence and alerts on the machine itself, and KnockKnock, which lists what is already installed to start automatically. Each of these options meant handing someone else’s code deep access to my laptop and, through it, to other people’s data, and even the free tools hold the same privileges. I did not want to grant that to anyone. Two Endpoint Security extensions are on this Mac all the same. I installed ESET to test it and never approved its extension. NordVPN added its Threat Protection extension on its own when I installed the VPN. Both are still waiting at the approval screen, so neither runs. LuLu, Objective-See’s firewall, does run here, as a network extension with no Endpoint Security client.
A sensor already on the machine
So I came at it from the other side, and was surprised to find a sensor already on the machine. Apple’s manual describes eslogger simply as a tool to log Endpoint Security events, and it has shipped with macOS since Ventura. Endpoint Security is the framework commercial EDR agents on the Mac are built on, and eslogger opens it to the command line. Windows went a similar way earlier: Microsoft Defender for Endpoint relies on behavioural sensors built into Windows 10 and 11, so turning it on is closer to onboarding a machine than to installing an agent. The difference is where the data goes. Defender’s sensor reports to Microsoft’s cloud under a licence, while eslogger writes to a file on the Mac and leaves the rest to its owner. I welcome that direction, with the sensor shipping as part of the operating system. It can subscribe to every notify event the framework offers, about eighty when it shipped and 116 on macOS 27.2, and writes each one as a line of JSON to standard output. That includes what Apple’s own defences do: a user overriding Gatekeeper (gatekeeper_user_override), an XProtect detection and its remediation (xp_malware_detected, xp_malware_remediated), a change to a privacy permission in TCC (tcc_modify), a new login item registered with Background Task Management (btm_launch_item_add). By design it takes no authorisation events, so it can record an action but never stop it. It needs root and Full Disk Access for the process responsible for it. No Endpoint Security client from anyone but Apple runs on this Mac. Because eslogger’s output is plain JSON on disk, it joins a SIEM like any other log source. In my case that is Splunk, where the Mac’s events sit next to the rest of the lab’s telemetry and feed the same correlation and alerting.
Thirty-one seconds
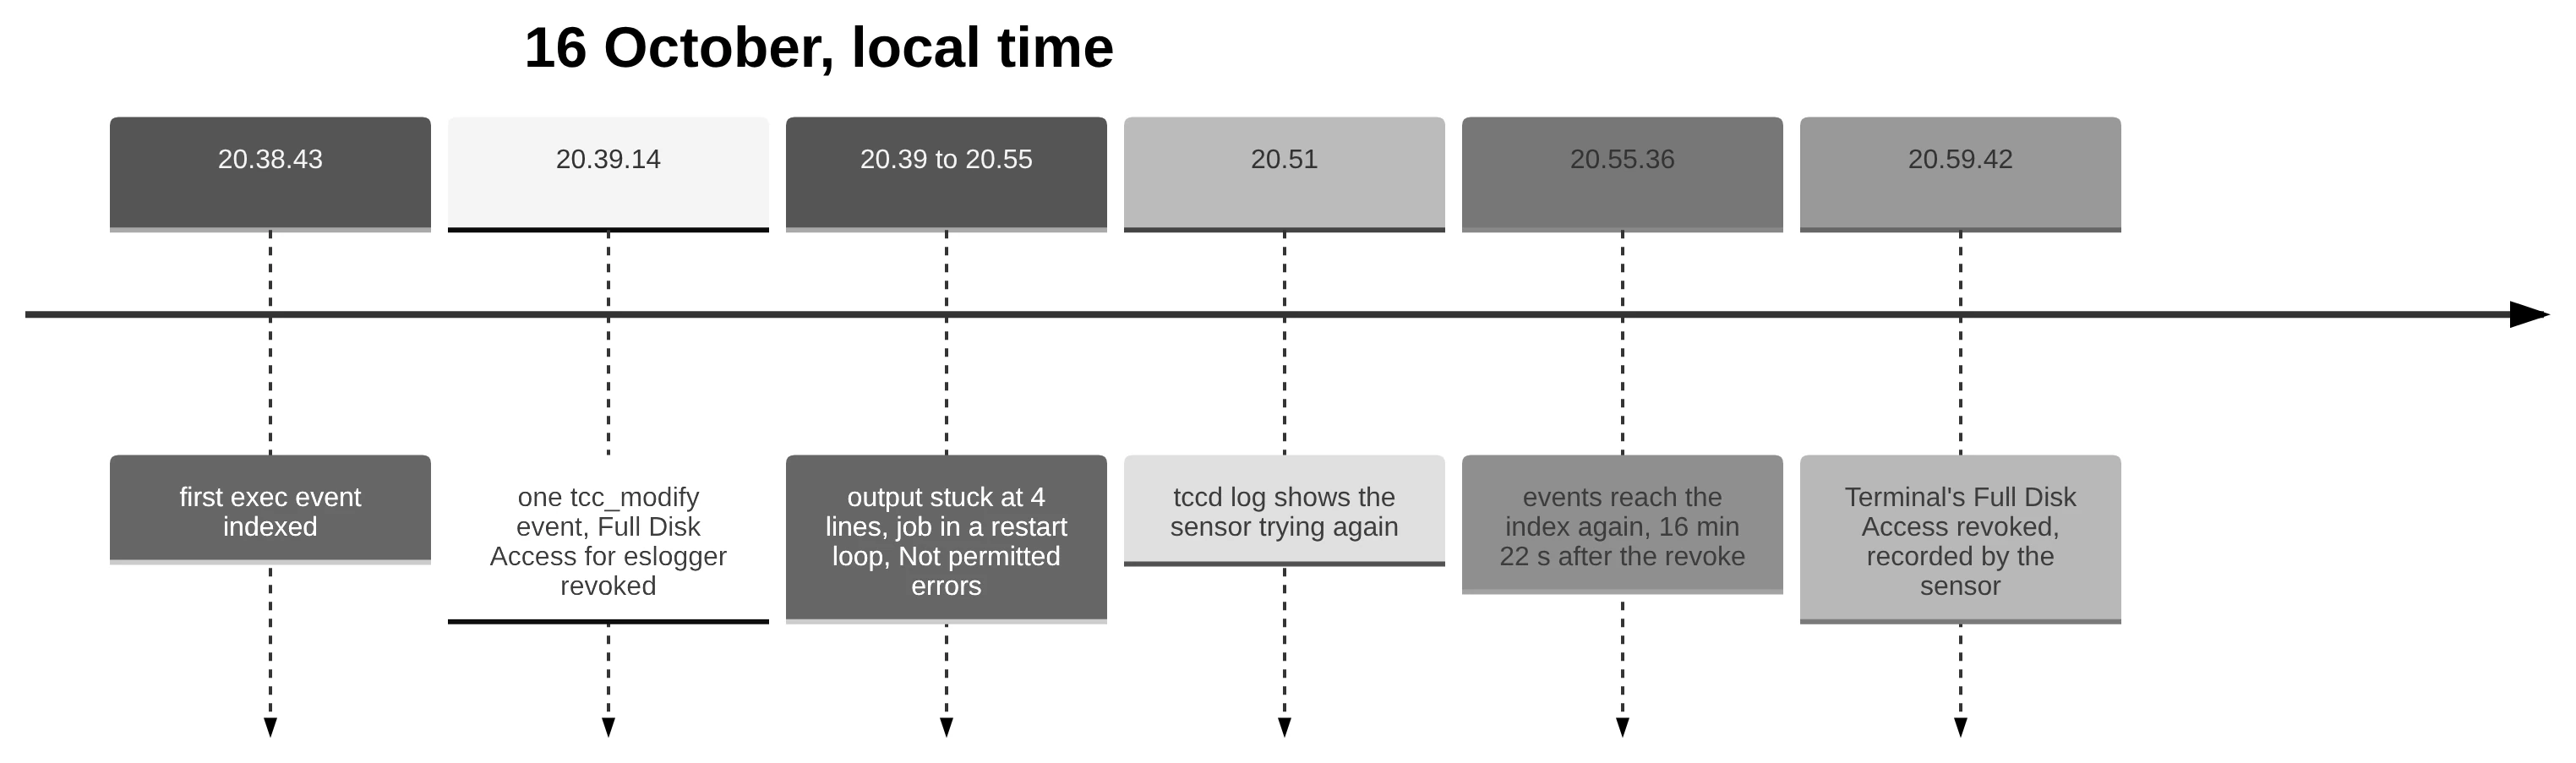
The first thing eslogger recorded for me that mattered was its own blinding, thirty-one seconds after its first event reached the index. I set the sensor up on the evening of Friday 16 October, and the first process launch arrived at 20:38:43 local time (UTC+2). At 20:39:14 came one more event, about the sensor itself: the Full Disk Access it needs to run had just been revoked. No attack was involved. I meant to take that access back from Terminal, which had needed it during setup, and in the same list I switched off the sensor’s own entry. After that event no new event reached the index from the Mac for sixteen minutes and twenty-two seconds. Terminal’s own revoke came later, at 20:59:42, and by then the sensor was running again and recorded it.
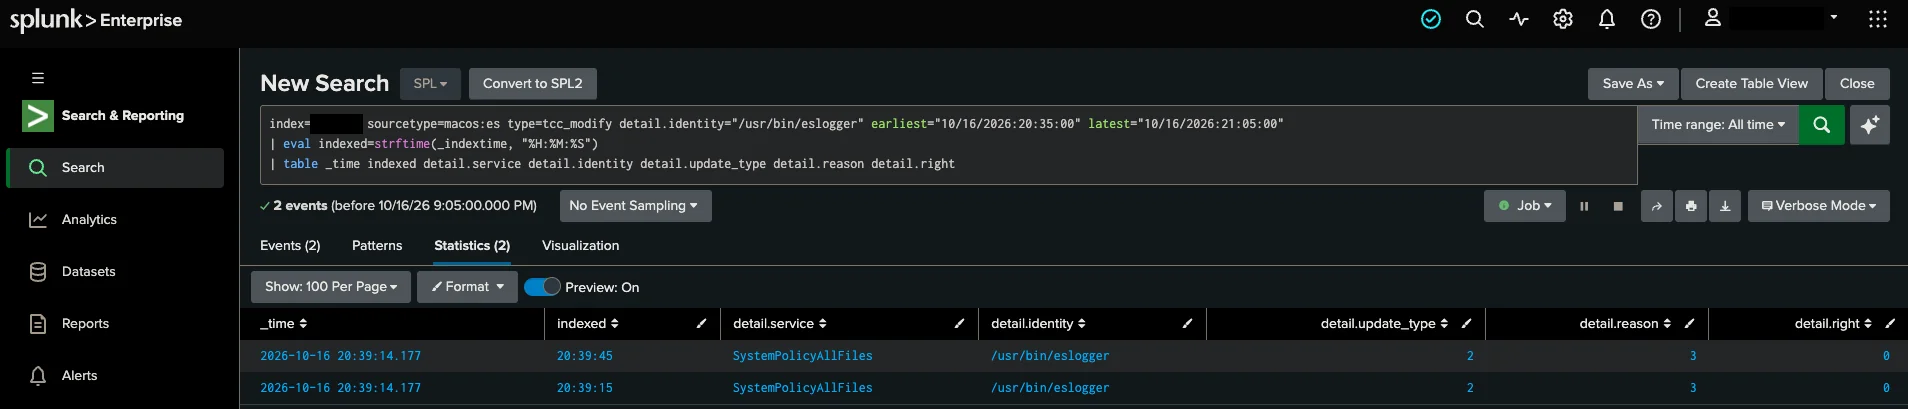
There was nothing to raise an alert yet: no heartbeat, no rule watching for silence, only the check I ran by hand at the end of the install. That check passed. The output file held four events, and all four were in Splunk with the right host and the right timestamps. What gave it away was a dashboard I had built for the Mac’s index before the sensor existed. Back in the terminal, the file still held four events. The launchd job was in a restart loop, and the error log repeated one code on every attempt, ES_NEW_CLIENT_RESULT_ERR_NOT_PERMITTED, which Endpoint Security returns when its client lacks the user’s TCC approval. The tcc_modify event was first read as a grant rather than a revocation. Around 20:51 tccd’s log shows the sensor trying again, and at 20:55:36 its events reached the index again, sixteen minutes and twenty-two seconds after the revoke. Nothing in that evening’s notes records restarting it by hand. launchd most likely did it on its own, as it did in a deliberate test on 4 November, when it restarted eslogger 31 seconds before I got to it. The heartbeat described below was built because of that evening.
Captured on 16 October, after the revoke:
-- eslogger.err:
Failed to create ES client: Not permitted to create an ES Client, responsible process needs TCC Full Disk Access authorization (ES_NEW_CLIENT_RESULT_ERR_NOT_PERMITTED)
Failed to create ES client: Not permitted to create an ES Client, responsible process needs TCC Full Disk Access authorization (ES_NEW_CLIENT_RESULT_ERR_NOT_PERMITTED)
-- events after the filter:
       4 /var/log/lab-telemetry/es.jsonl
2026-10-16 20:51:47.437 Df tccd[499:3421e4] [com.apple.TCC:access] AUTHREQ_SUBJECT: msgID=47755.1, subject=/usr/bin/eslogger,
One Mac, one pipeline
Everything measured in this series comes from that one Mac over a few weeks, with no MDM, no corporate identity provider, no corporate VPN and no EDR licence on it. I also poke at macOS internals on purpose, which can inflate the counts exactly where detection looks: sudo, permission changes, new launch items, unsigned binaries. The volumes and the mix of events therefore describe this machine. The mechanisms behind them, such as how Endpoint Security attributes an event or what sleep does to a sensor, come with macOS itself.
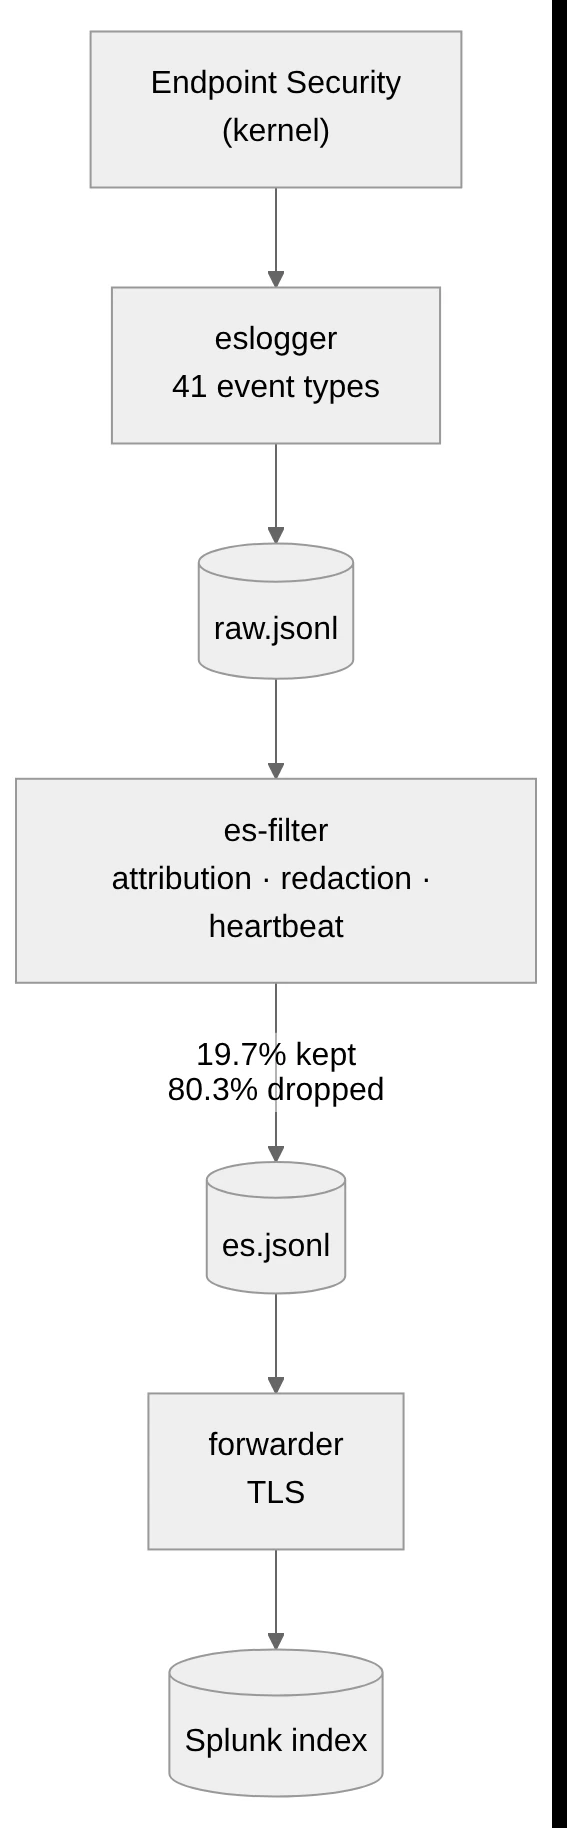
Of the four programs in this pipeline, Apple ships one. It runs as a launchd daemon, which makes eslogger itself the responsible process, and it runs only as long as that process holds Full Disk Access. Without it, Endpoint Security refuses the client and says why: Failed to create ES client: Not permitted to create an ES Client, responsible process needs TCC Full Disk Access authorization (ES_NEW_CLIENT_RESULT_ERR_NOT_PERMITTED). Started by hand from Terminal, eslogger runs on Terminal’s access instead, because Terminal becomes the responsible process. Under launchd it subscribes to 41 event types and writes one JSON object per line into a raw file, which is reclaimed when it reaches 64 MB. A small filter I wrote, es-filter, does the work eslogger leaves to its user: it cuts the routine noise, strips what is bulky or should not leave the machine, records who started each process and on whose behalf, and writes a heartbeat every sixty seconds. A Splunk Universal Forwarder carries the rest over TLS.
What nineteen days of one Mac look like
Before writing a single rule I wanted to know what one Mac costs to watch, because volume decides the licence, the storage and how much an analyst has to read. The index has existed since 16 October, and the numbers below run from then through 3 November: nineteen calendar days, eighteen of them full. In that time it received 205,234 unique events. The median full day brought 8,372 of them and 9.65 MB of JSON, and the average event weighs 1.14 KB. The quietest day, 23 October, had 4,621 and the busiest 32,416. That busiest day was 20 October, when the subscription grew from 14 event types to 41 and I spent the evening testing the new ones. Every count in this part is of unique events, because the index also holds 548 events the forwarder sent twice. The window will grow: I will rerun the same queries as the Mac keeps reporting and update the numbers here, and every update, like every correction, is recorded at the end of this entry.
index=mac sourcetype=macos:es type=* earliest="10/16/2026:00:00:00" latest="11/04/2026:00:00:00"
| dedup _raw
| timechart span=1d count
Most of that volume is a single event type. Process launches (exec) make up 91.4 per cent of what reaches the index, and the filter’s own heartbeat another 7.3. Everything else together is 1.4 per cent, 2,833 events, and that remainder is where most detection logic lives. Several types were only subscribed on 20 October, so the table gives the date each was subscribed from. Background Task Management, which covers launch agents, launch daemons and login items, reported 43 additions. That is an upper bound on new persistence, because it also counts items I added myself, such as the sensor’s own two daemons. Of the 41 subscribed types, 27 produced no event at all: every XProtect and Gatekeeper type, remote_thread_create, cs_invalidated, settime and all thirteen Open Directory types among them. A type that stays silent has not yet been shown to work. That takes a positive test, which later parts of this series run. An event type left out of the subscription never reaches the filter at all, so no later change in Splunk can bring it back.
| type | events | subscribed since |
|---|---|---|
| exec | 187,497 (91.4 %) | 16.10 |
| filter_heartbeat | 14,904 (7.3 %) | 20.10 |
| authentication | 1,719 | 16.10 |
| mount | 320 | 20.10 |
| kextload | 197 | 20.10 |
| sudo | 148 | 16.10 |
| lw_session_lock / lw_session_unlock | 127 / 127 | 20.10 |
| tcc_modify | 121 | 16.10 |
| btm_launch_item_add / remove | 43 / 18 | 16.10 |
| filter_start | 5 | 20.10 |
| profile_add | 3 | 16.10 |
| su | 3 | 16.10 |
| lw_session_login / lw_session_logout | 1 / 1 | 20.10 |
| 27 other subscribed types | 0 | 16.10 or 20.10 |
index=mac sourcetype=macos:es type=* earliest="10/16/2026:00:00:00" latest="11/04/2026:00:00:00"
| dedup _raw
| stats count by type
| eventstats sum(count) as total
| eval pct=round(100*count/total, 1)
| sort - count
Most of the volume ends at the filter. Since 20 October at 20:23, when it started counting, it has read 725,088 lines from eslogger and passed on 142,788, so 80.3 per cent never left the machine. Every one of the 582,300 dropped lines was a process launch from a reviewed list of high-volume platform helpers that start and exit all day. Here eslogger and a commercial agent part ways. Endpoint Security lets a native client mute a process or a path, so that its events never reach the client at all, and since Ventura it can also mute by the target path of a file event. An EDR agent uses that to drop noise at the source. eslogger has no such option. Its only settings are the event list and the output, and the one thing it mutes on its own is its own process group. Every one of those 582,300 launches was therefore turned into JSON, written to disk, read back by the filter and thrown away. On this Mac that round trip is cheap in CPU and heavy on disk. Over two and a half days of running, eslogger used 105.6 seconds of CPU and es-filter 161.1, 0.05 and 0.07 per cent of one core, with 8.4 MB and 14 MB of memory. The raw file was reclaimed 45 times at 64 MB, close to 3 GB of JSON written in fourteen days, roughly 4 KB per raw line against 1.14 KB per event that survives the filter.
index=mac sourcetype=macos:es type=filter_heartbeat earliest="10/20/2026:20:23:13" latest="11/04/2026:00:00:00"
| dedup _raw
| stats sum(lines_in) as lines_in sum(lines_out) as lines_out sum(dropped_exec) as dropped_exec
        sum(parse_errors) as parse_errors sum(seq_gaps) as seq_gaps sum(seq_resets) as seq_resets
        sum(reclaims) as reclaims
| eval dropped_pct=round(100*(lines_in-lines_out)/lines_in, 1)
The heartbeat carries counters that say whether the pipe itself is healthy. Every event eslogger writes has a sequence number, global_seq_num, and the filter checks it for gaps before it throws anything away. Over the fourteen days since 20 October it counted zero gaps within any run of eslogger, zero parse errors and one reset of the sequence, at 17:39 on 28 October, when the forwarder, the filter and eslogger restarted together for a reason I have not found. The zero parse errors include the evening of 1 November, when the Mac installed macOS 27.2 and restarted. eslogger and the filter came back on their own, and the filter parsed the new system’s output without a single error.
Those counters cover the first hop only. global_seq_num is Apple’s own drop counter: the kernel raises it by one for every message it generates for a client, so a jump means the kernel produced more events than the client could take and dropped the rest. Zero gaps therefore means that, while eslogger ran, the kernel never had to drop anything for it. A restart of eslogger starts a new sequence, so whatever happened while it was down leaves no gap, which is exactly how 16 October looked. The filter counts a reset only when eslogger restarts under a running filter; a restart of the filter itself, as on 1 November, starts its reference afresh.
Two events that look alarming and are not
Two event types looked alarming at first and turned out to be ordinary. The first was kextload. After the history of kernel extensions above, they should be rare on an Apple silicon Mac, yet the index held 197 of them. Grouped by identifier, every one was a DriverKit driver from Apple: 183 for AppleUserHIDDrivers, which handles input devices, and 14 for AppleUserECM, a USB networking driver, loaded for a USB-C Ethernet adapter that identifies itself as “USB 10/100/1000 LAN”. On this Mac, Endpoint Security reports these user-space driver extensions under the same event type as kernel extensions; Apple documents kextload for kernel extensions only. Its counterpart kextunload is subscribed too and recorded nothing. A rule on kextload that does not know this would have fired 197 times since 20 October on this Mac.
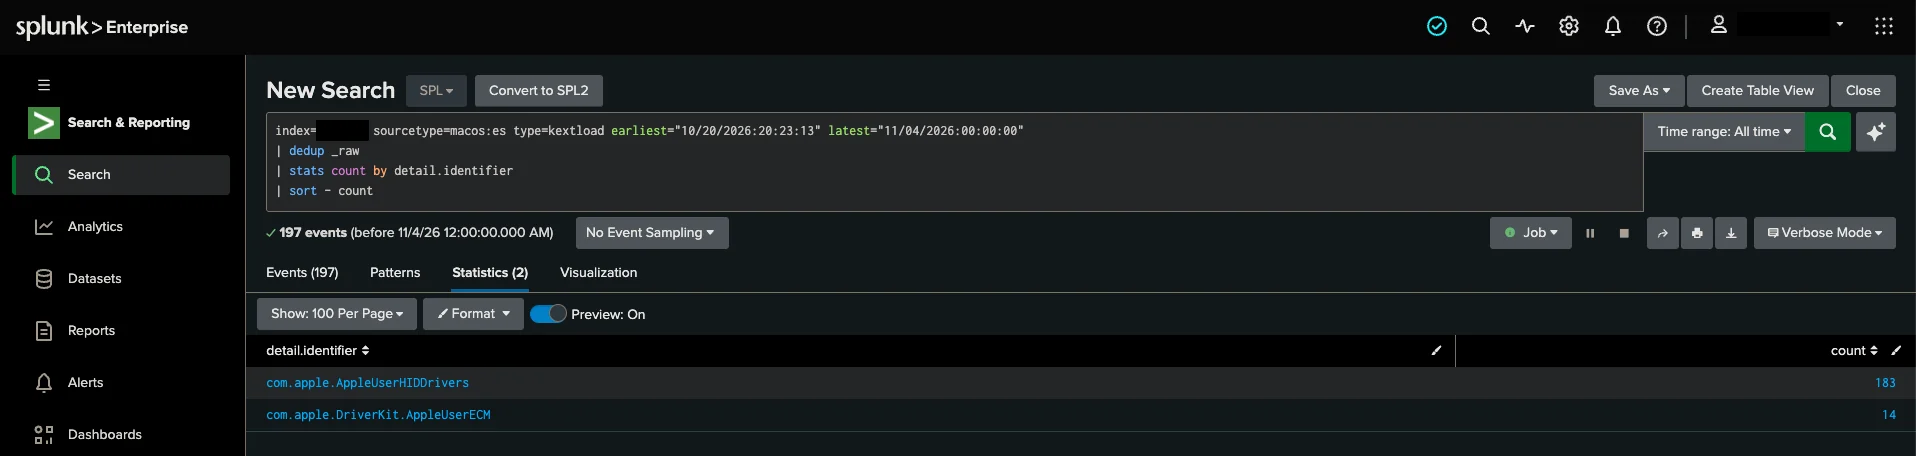
index=mac sourcetype=macos:es type=kextload earliest="10/20/2026:20:23:13" latest="11/04/2026:00:00:00"
| dedup _raw
| stats count by detail.identifier
| sort - count
The second was profile_add, three of them on a Mac not enrolled in any MDM. All three came from mdmclient within 0.47 seconds, on 1 November at 21:35 local time: one installation and two updates of a user-scoped profile called “ManagedSettings User Settings”. That was about an hour and a half after the Mac had installed macOS 27.2. On this Mac a profile installation is rare enough to read every time. On a managed fleet the MDM installs profiles routinely, and the same event type becomes background.
From 14 event types to 41
The subscription started small. The first version gave eslogger 14 event types, chosen for what I could already write rules against: process launches (exec), privilege changes (sudo, su, authentication), persistence (btm_launch_item_add and btm_launch_item_remove), permission and profile changes (tcc_modify, profile_add), remote access and login (openssh_login, screensharing_attach, login_login) and Apple’s own defences (gatekeeper_user_override, xp_malware_detected, xp_malware_remediated). After a review of what was missing, the second version, live from 20 October at 20:23, grew it to 41. The additions were screen lock and session events, Open Directory changes to users and groups, mount, kernel extension loads and unloads, cs_invalidated for a process whose code signature stops being valid, remote_thread_create, settime, and the missing halves of pairs, such as logout next to login and profile_remove next to profile_add. File events such as open, write and rename stayed out, because I have not yet measured what they would cost on a working laptop. Inside the subscription there are two treatments. Process launches are subscribed in full and filtered hard, because attribution of everything else depends on them. Every other subscribed type passes the filter in full, from rare ones such as sudo and TCC changes to busier ones such as mount.
The first test of the new types failed. I locked the screen, unlocked it, and eleven minutes later the index held no session events at all. eslogger’s own arguments listed all 41 types, so the subscription itself was right. A plain grep lw_session on the raw file then found a match, which looked like confirmation until it turned out to be my own grep command, recorded as an exec event with lw_session in its arguments. At 20:35 I tried to watch the two session events directly, with a second eslogger started by hand from Terminal, and it refused to start because Terminal had no Full Disk Access. Session events started arriving at 21:00, with the first lock, and the first unlock followed at 21:04. Since then the index has counted 127 locks and 127 unlocks, and in time order they alternate without a single exception.
The positive control that happened by accident
The install of that version also produced the first useful positive test, by accident. Registering the sensor’s own two launch daemons generated two btm_launch_item_add events 16 milliseconds apart. I expected the instigator to be the installer script. It was /usr/libexec/smd, Apple’s service management daemon, and the process that reported both events was backgroundtaskmanagementd. A persistence rule keyed on who installed an item would have attributed both items to Apple. The rule therefore keys on what was installed, the item’s URL and its executable path, and those two events are its positive test. For the filter’s daemon the executable path is /usr/bin/python3, so it is the item’s URL that names the filter.
A commercial agent makes these choices for you. Its vendor decides which event types the agent subscribes to, which of them it ships to the cloud and in what form, and the console shows the result. With eslogger the subscription is a line of arguments in a launchd plist, visible and editable.
Two rules that fall out of the cold open
The first thing built on the event from 16 October was a table on the Mac’s Splunk dashboard that lists every tcc_modify with the service, the subject, what changed, whether the user was prompted, the resulting right and the process behind it. The event reads: service SystemPolicyAllFiles, subject /usr/bin/eslogger, update_type 2, reason 3, right 0. The enums are not self-explanatory. The dashboard first labelled them from the Mac’s own data, every tcc_modify since the index started: update type 1 as a grant and 2 as a revoke or a modify, reason 3 as “no prompt”, right 5 as “limited”. Apple’s header ESTypes.h says otherwise. Update type 1 is the creation of a record, 2 its modification and 3 its deletion. Reason 2 means the user answered a prompt and 3 means the user set the permission in System Settings. Right 3 is limited, and 5 is a different value altogether. Read with the header, the event of 16 October says exactly what happened: an existing record modified by the user in System Settings, ending in denied.

index=mac sourcetype=macos:es type=tcc_modify earliest="10/16/2026:00:00:00" latest="11/04/2026:00:00:00"
| dedup _raw
| eval actor=coalesce('detail.responsible.path', 'detail.instigator.path')
| eval action=case('detail.update_type'==1, "create", 'detail.update_type'==2, "modify", 'detail.update_type'==3, "delete", true(), 'detail.update_type')
| eval mode=case('detail.reason'==2, "user answered a prompt", 'detail.reason'==3, "user set in System Settings", 'detail.reason'==4, "set by the system", 'detail.reason'==5, "service policy", true(), 'detail.reason')
| eval right=case('detail.right'==0, "denied", 'detail.right'==2, "allowed", 'detail.right'==3, "limited", true(), 'detail.right')
| table _time detail.service detail.identity action mode right detail.instigator.path actor
| sort - _time
The cold open gave the first rule directly. When the sensor loses Full Disk Access in System Settings, the change arrives as a tcc_modify event, and on 16 October it was the last thing the sensor sent before it went quiet. Building the rule exposed a wrong assumption. A note in the lab’s documentation described update_type = 2 as a revocation. The data said otherwise: a grant made in System Settings also arrives with update type 2, which means modify, so a rule built on that note would have fired on grants as well. The rule now keys on the outcome: the right denied (detail.right 0, which the filter labels right_name=denied) on SystemPolicyAllFiles for the sensor’s own identity, which is exactly what the event of 16 October contains. A deliberate test on 4 November fired it: four switches of the sensor’s entry with confirmation in 22 seconds, recorded by the running sensor with rights 2, 0, 2 and 0. An agent deployed through MDM gets the profile-granted Full Disk Access described earlier, with the vendor’s tamper protection on top. On a Mac without MDM, eslogger’s access is an ordinary toggle in the same list as every other app’s. An MDM could grant the sensor its access the same way it grants an agent’s, through a privacy preferences (PPPC) profile.
index=mac sourcetype=macos:es type=tcc_modify earliest="10/16/2026:00:00:00" latest="11/05/2026:00:00:00"
    detail.identity="/usr/bin/eslogger" detail.service="SystemPolicyAllFiles" detail.right=0
| dedup _raw
| table _time detail.service detail.identity detail.update_type detail.reason detail.right
When the screen and tccd disagree
The same test turned up something I didn’t expect. On macOS 27.2, after I reopened System Settings, the Full Disk Access list showed the sensor as switched off while tccd went on allowing it: its log said Allowed (System Set) at every start of eslogger, and the heartbeat kept counting lines. Taking the access away then meant turning the switch on first and off again. The tcc_modify events do not settle it either, because they name the service as System Settings presents it, SystemPolicyAllFiles, even when tccd keeps the grant under a different service. On this Mac the state of the sensor’s permission therefore comes from three sources that do not go through the screen: tccd’s log line at every start of the sensor, the tcc_modify events, and the heartbeat. I have reported the discrepancy through Apple Security Research, and the details will follow once Apple has answered.
The sensor goes quiet
The second rule watches for silence.
The original plan was simple: alert when the Mac’s index is empty while its forwarder is still alive in Splunk’s internal logs.
The heartbeat broke that plan before the rule shipped. Once the filter writes an event every sixty seconds, the index is never empty while the filter runs, even if eslogger behind it has died. The same heartbeat would have fooled two checks that already existed, a line in another rule’s context and a morning review, because both read the newest event in the index as the age of the telemetry. Both now count endpoint events only and ignore the filter’s own. The absence rule was redefined on the heartbeat itself: no heartbeat for five minutes while the forwarder is alive, or heartbeats reporting zero lines read for ten minutes, which means the filter is alive and eslogger is not.
| state | how it shows | what brings it back |
|---|---|---|
| alive | heartbeats with lines read | |
| no heartbeat | no heartbeat at all: sleep, or the filter stopped | heartbeats resume |
| sensor dead | heartbeats reporting zero lines read for 10 minutes | eslogger restarted |
| pipe dead | no heartbeat for 5 minutes while the forwarder is alive | filter restarted |
| blinded | tcc_modify, right denied for the sensor | access restored |
On a laptop, the no-heartbeat rule meets sleep. In the fourteen days since the heartbeat started there were 238 gaps longer than five minutes, 90.7 hours in total, and 168 of them began between midnight and nine in the morning. Applied to those gaps without the condition that the forwarder is alive, the rule would have fired 238 times; with it, six. What those gaps are made of, and what else goes missing on the way from the kernel to the index, is the subject of part 3.
Who did it
Several of the events above name more than one process. The burst of 50 tcc_modify events on 3 November at 23:47, all within three seconds, names Terminal as the subject of SystemPolicyAppDataDetailed, sandboxd as the instigator and tccd as the process that reported it. Which of the three did it is the question part 2 answers.
Sources
- Apple, eslogger(1) manual page: https://keith.github.io/xcode-man-pages/eslogger.1.html
- Apple, WWDC22, What’s new in Endpoint Security: https://developer.apple.com/videos/play/wwdc2022/110345
- Apple Platform Security, kernel and system extensions: https://support.apple.com/guide/security/sec8e454101b
- Apple Platform Security, protecting against malware in macOS: https://support.apple.com/guide/platform-support/sup95904c270/web
- Apple, es_message_t global_seq_num: https://developer.apple.com/documentation/endpointsecurity/es_message_t/global_seq_num
- Apple Security Research: https://security.apple.com/
- Eclectic Light, How macOS is moving away from kernel extensions (2024): https://eclecticlight.co/2024/07/24/how-macos-is-moving-away-from-kernel-extensions/
- nxlog, macOS Endpoint Security event types by version: https://docs.nxlog.co/agent/v6.6/im/maces.html
- Objective-See, TCC events in macOS 15.4: https://objective-see.org/blog/blog_0x7F.html
- Objective-See tools: https://objective-see.org/tools.html
- CrowdStrike, small business bundles: https://crowdstrike.com/en-us/solutions/small-business/antivirus
- ESET Endpoint Security for macOS, lslog: https://help.eset.com/ees_mac/10/en-US/utility_events.html
- SecurityWeek, Windows endpoint security platform preview: https://www.securityweek.com/microsoft-to-preview-new-windows-endpoint-security-platform-after-crowdstrike-outage/
- Help Net Security, Microsoft limits kernel access: https://www.helpnetsecurity.com/2024/11/19/windows-kernel-security-vendors/
Updates and errata
- First published. Data from 16 October to 3 November 2026.
                     .-@%%#%@@@@@@@@@@%%%###%%%%%%@@@%%%@%%%
             ..:::-===#%%%%%%%%%%%%%@%###*****#%%%%%@@%%@@@%
        .:=*##****#*+#%%####********%%##*####*****##%@@@@%@@
     :=+######%####%%####%%%%%%%%##*%@%%##%%##*++++***#%@%*:
   :+#######%%@@%###*++*#%%%@%%%#*###%%%%%@%#*++=+=++*+**-
  *%##*****##%@@@@@%##%%%@@@@@@@%@%@@@@@@@%#***+++++=+###-
 .@#****##%%@@@@@@@@@@@@@@@@@@@@@@@@@@@@@@%%%%%#*+==+=*##=
 :%#*##*#%@@@@@@@@@@@@@@@@@@@@@@@@@@@%%@@@@@@@%##*==***##=
 :%#=+*#%@@@@@@@@@@@@@@@@@@@@@@@@@@@@@%%@@@@@@%#*++*#@#=.
 .+====+#%@@@@@@@@@@@@%%%%@@@@@%%%%%%@@%%@@@@@%#**@@@+.
    .. .:*@@@@@@@@@@%%####%@@@@##***##%%%@@@@%%#%@@%:
          -%@@@@@@@%**+++*#%@@%*=-===*##%%@@@@%*@@#.
           :@@@@@%%#+++-=-+%@@*+--+++****#%@@%*=@*
            -%%%%#%%##*==-=#%%+=:-=*##%%**%@@%=+@
            .#@#%%%@%%%#+=++##+=-=*%%*%%#*###*-##
             =###%@%@@@%*=++**===*%%@%%#+=-====@=
              =+*#%%@@@##*++**==+*###*+==-:===#@:
              .+****##%#*+++**+=-=+*+====--+#*%@%+:
               :=+***##*==++***=---+++=--=#%@@@@@@@%=
                :-=*###+++**##*+===+===:+%%##%@@@@@%%.
                 :-+**#*+**#%%#+==-+-::=%##%@@@@@%*+=.
                  :=+**+**#%%%%*+=--::=#****#@@#*+--=.
                   --+***#%%%%%*+==--:=*+--::==-:::=-
                   .:=+++*%%%%%#*=-::-----::::--==++
                    .=++*#%@@@%%%%+:::-------:::-=+.
                  . .==+#@@@%%%%%%%-::---=-----::--
                 -:.:.==#%%%%##%%%*-.-=--.==---::-.
                 :.:: .=+*%@%**#%*=:.::   .----..:
                        .:-=++**+=:.       :--:.::
                                           .-:..:.
            .++++==-..                      -:..:
           .%-  .:-=+++++=-:.              == ...
           -%          .:-=+++++=-:        -: ....
            **:.              .:-==#-      . .....
             -+++++=-:.            +#      ....::
                  .-=++*++=-:.     =%      .:.:.-:
                        ..-==++++==%:        .. -=
                               .:-=.
                     @* ..:..        ....:::......   ... ...
             %%###*+++:............. .:::-----:.....  ...  .
        %#+-::----:-=:..::::--------..---::::-----::.    .
     #+=::::::.::::..::::.......:::-. ..::..::-====---:. .-#
   #=:::::::..  .:::-==-:... ...:-:::..... .:-==+=+==-=--*
  -.::-----::.     .::....      . .    .  .:---=====+=:::*
 % :----::...                             .....:-=++=+-::+
 #.:--:-:.                           ..       .::-++---::+
 #.:+=-:..                            ..      .:-==-: :+%
 %=++++=:.            ....     ......  ..     .:=-   =%
    %% %#-          ..::::.    ::---::....   .::.  .#
          *.       .--===-:.  .-+*+++-::..    :-  :%
           #     ..:===*+*=.  -=**===----:.  .-+ -
            *....:..::-++*+:..=+#*+-::..--.  .+=.
            @: :.......:=+==::=+*+-..-..:-:::-*::
             +:::. .   .-+==--+++-.. ..:=+*++++ +
              +=-:..   ::-==--++=--::-=++*#+++: #
              %=----::.:-===--=+*+=-=++++**=:-. .=#
               #+=---::-++==---+***===+**+:.       .+
                #*+-:::===--::-=+++=+++#=..::.     ..%
                 #*=--:-=--:..:=++*=*##+.::.     .-=+%
                  #+==-=--:....-=+**##+:----:  :-=*#+%
                   **=---:.....-=++**#+-=**##++*###+*
                   %#+===-:....:-+*###****####**++==
                    %+==-:.  .....=###*******###**=%
                  % %++=:   .......*#%***+*****##**
                 *#%#%++:....::...-*%*+**%++***#%*%
                 #%## %+=-. .--:.-+#%##   %**#*%%#
                        %#*+==--=+#%       #**#%##
                                           @*#%%#%
            %====++*%%                      *#%%#
           %.*  %#*+=====+*#%              +* %%%
           *.          %#*+=====+*#        *# %%%%
            --#%              %#*++:*      % %%%%%
             *=====+*#%            =:      %%%%##
                  %*+=====+*#%     +.      %#%%%*#
                        @%*++====++.#        %% *+
                               %#*+%